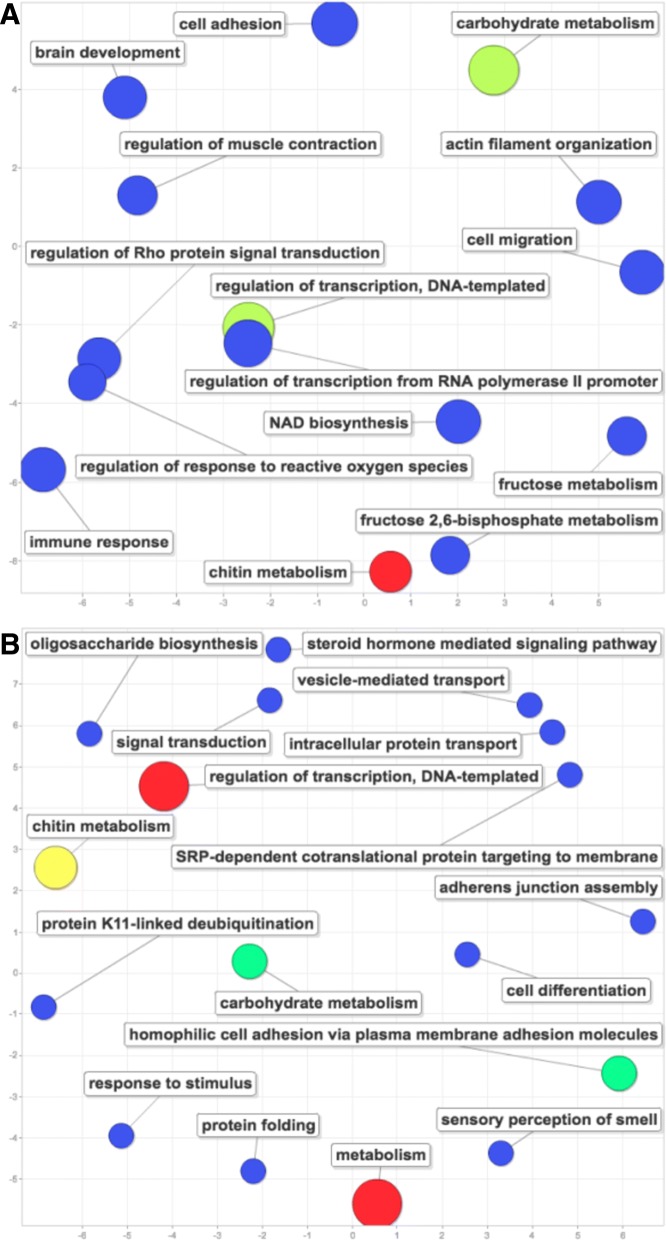
Fig. 5.
Gene ontology results for the 122 “tolerance” and 125 “resistance” DEG candidates in our data. GO analysis results for the 122 DEGs related to our “tolerance” hypothesis (A) and for the 125 DEGs related to our “resistance” hypothesis (B). The color and size of the circles both represent the number of genes in that ontology. The x-axis and y-axis are organized by SimRel, a semantic similarity metric [106]

