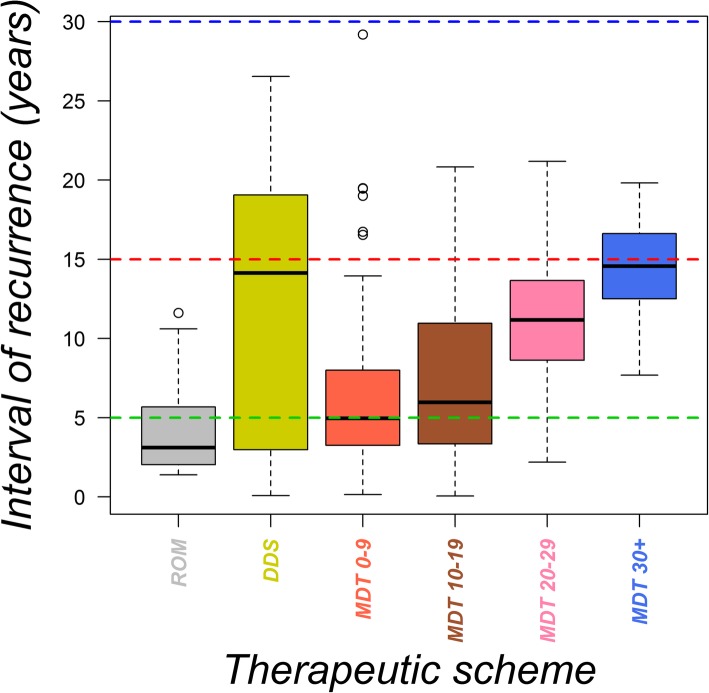
Fig. 2.
Time interval of leprosy recurrence in years per type of therapeutic scheme adopted. Midlines, upper and lower limits of the box are the median, third and first quartiles, respectively. Ninety-nine % of the data are contained between the upper and lower whiskers. Outliers are represented by open circles

