Fig. 3.

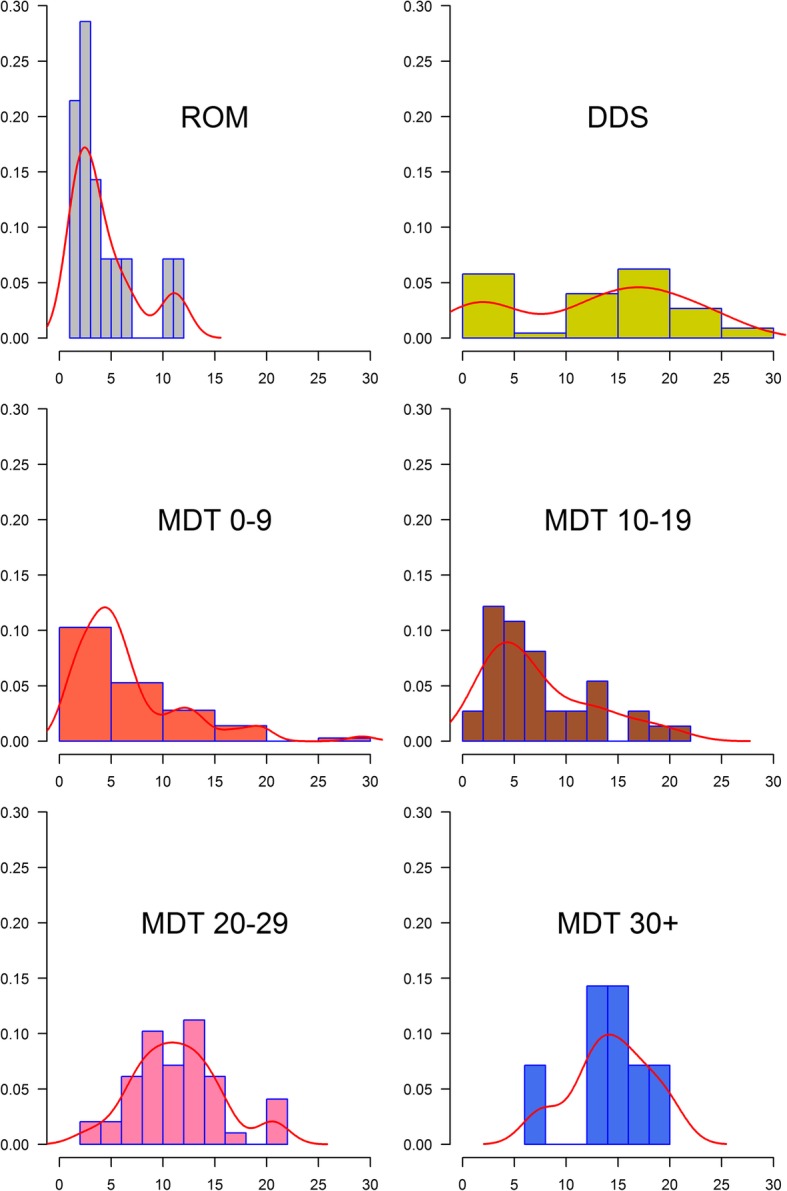
Histograms of interval of leprosy recurrence per therapeutic scheme. Y-axis is the relative frequency (probability) and X-axis is the interval of leprosy recurrence. Red lines are histogram-based density functions

Histograms of interval of leprosy recurrence per therapeutic scheme. Y-axis is the relative frequency (probability) and X-axis is the interval of leprosy recurrence. Red lines are histogram-based density functions