Fig. 1.
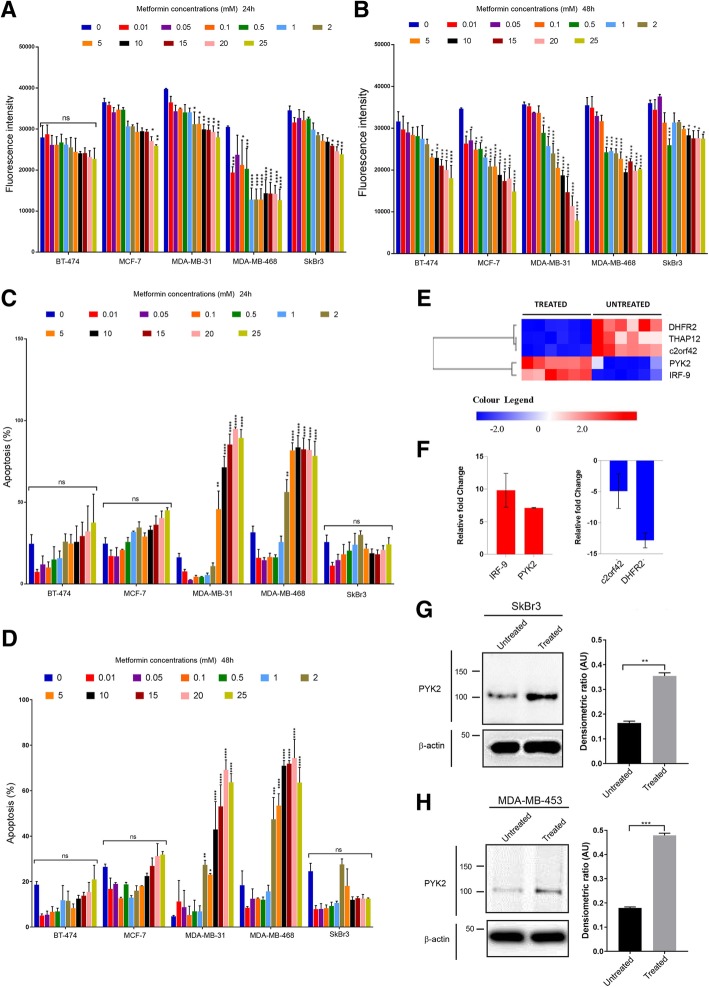
Effect of metformin on cell proliferation and apoptosis of breast cancer cell lines representing different phenotypes of breast cancer. a, b Effect of different concentrations of metformin on cell proliferation of BT-474, MCF-7, MDA-MB-231, MDA-MB-468 and SkBr3, 24 h and 48 h post-treatment. N = 3 (6 replicates). c, d Effect of different concentrations of metformin on apoptosis of BT-474, MCF-7, MDA-MB-231, MDA-MB-468 and SkBr3, 24 h and 48 h post-treatment. N = 3 (2 replicates). The statistical values are provided as Additional file 4: Data S1. e Heatmap of microarray analysis showing upregulated (in red) and downregulated genes (in blue) in untreated vs. treated cells. Bonferroni corrected P value ≤0.05. N = 6 (6 replicates). f RT-PCR analysis of relative gene expression of selected IRF-9 and PYK2 (Upregulated), and c2orf42 and DHFR2 (downregulated). N = 3 (3 replicates). g, h Immunoblot images representing PYK2 expression in metformin treated and untreated SkBr3 and MDA-MB-453 cell lines. Densitometric ratio is measured by Arbitrary Units (AU). Student t-test, **P = 0.0030 and ***P = 0.0006. N = 3 (3 replicates)

