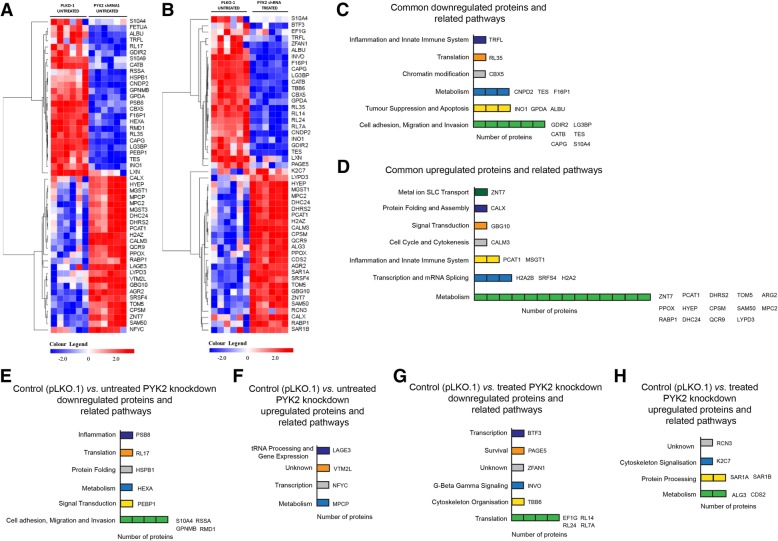
Fig. 5.
Proteomic analysis of 3546 proteins showing several upregulated and downregulated proteins and related pathways in untreated controls and metformin-treated and untreated PYK2 knockdown SkBr3 cells. a Heatmap representing the top 25 upregulated and downregulated proteins in untreated control and PYK2 knockdown SkBr3 cells. b Heatmap representing the top 25 upregulated and downregulated proteins in untreated control and PYK2 knockdown metformin-treated SkBr3 cells. N = 1 (6 replicates) (c, d) Schematic representation of identified downregulated and upregulated proteins and related pathways that are in common and different between untreated and metformin-treated PYK2 knockdown cells. e, f Schematic representation of identified downregulated and upregulated proteins and related pathways in untreated PYK2 knockdown cells. g, h Schematic representation of identified downregulated and upregulated proteins and related pathways in metformin-treated PYK2 knockdown cells

