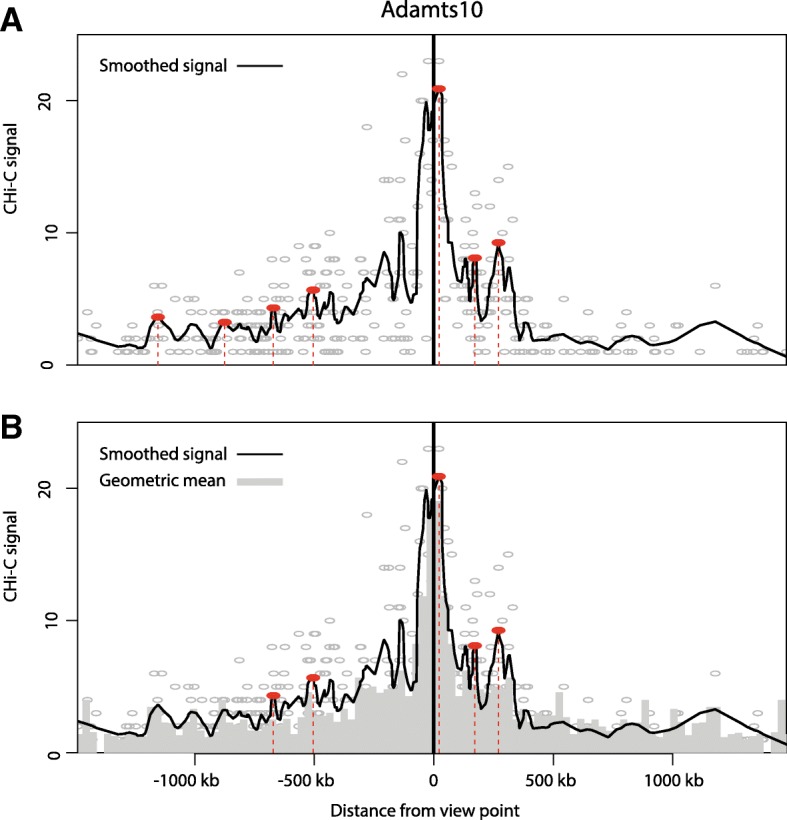
Fig. 1.

Interaction calling by ChiCMaxima. a Virtual 4C profile derived from one mES CHi-C replicate centered on the bait Adamts10 promoter. The numbers of raw CHi-C sequence reads are plotted as gray circles against their genomic location, and the black line shows the loess-smoothed profile (span = 0.05). Red dotted lines and filled circles denote the positions of called interactions, defined as local maxima of smoothed signal within a fixed number of covered restriction fragments (window = 20). b The same virtual 4C profile as a, plotted with a bar chart of the geometric means for sequence reads from the profile, stratified by genomic distance between the bait and interacting region (bins of 30 kb). Red dotted lines and filled circles denote the same local maxima as a, which have smoothed signal greater than the geometric mean for the corresponding interaction distance, and so are kept as ChiCMaxima-called interactions
