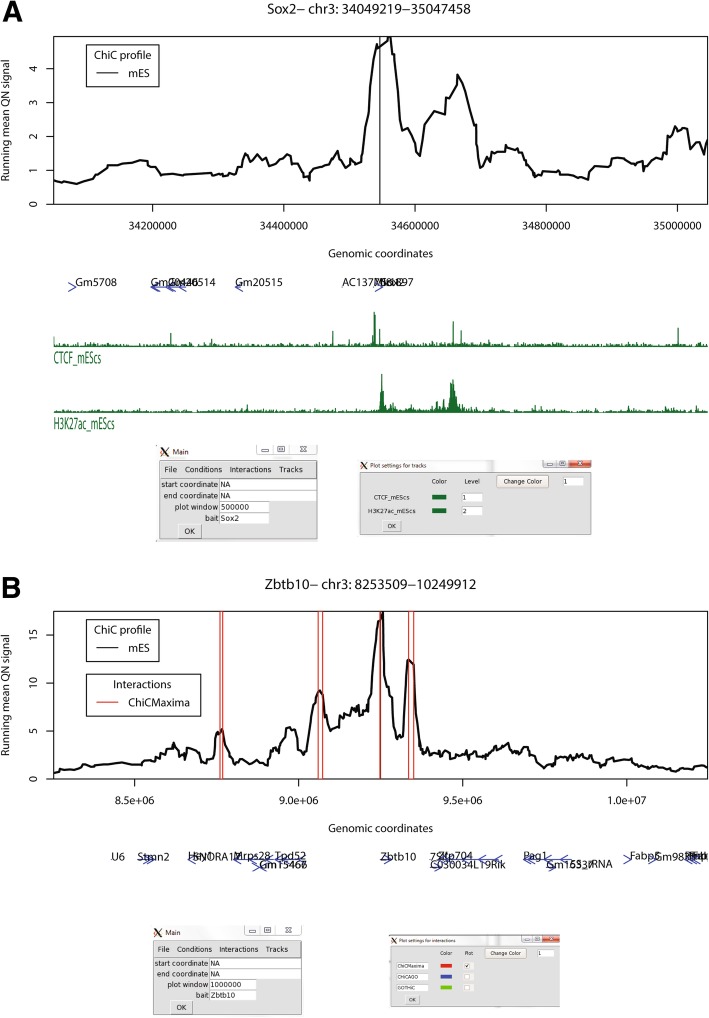
Fig. 7.
Some functionalities of ChiCBrowser. a A screenshot of ChiCBrowser, showing the mES CHi-C profile for 500 kb up- and downstream of the bait Sox2 promoter. Gene positions (blue) and selected mES ChIP-seq tracks (green) are shown below the profile. The main ChiCBrowser user interface window is shown underneath (left), where the bait and plot window have been specified. A sub-window, called from the Tracks menu (right), allows the color and level of the epigenomic profiles to be controlled by the user. Epigenomic tracks that are given the same level (for instance, the same histone mark in different tissues) are scaled to the same level on the y-axis so that the profiles are visually comparable. b As for a, a screenshot of the mES CHi-C profile for 1 Mb up- and downstream of the bait Zbtb10 promoter. Open red rectangles show the position of interactions called by ChiCMaxima. The sub-menu on the bottom right, called from the Interactions menu, allows the user to control which interaction lists to annotate on the CHi-C plot

