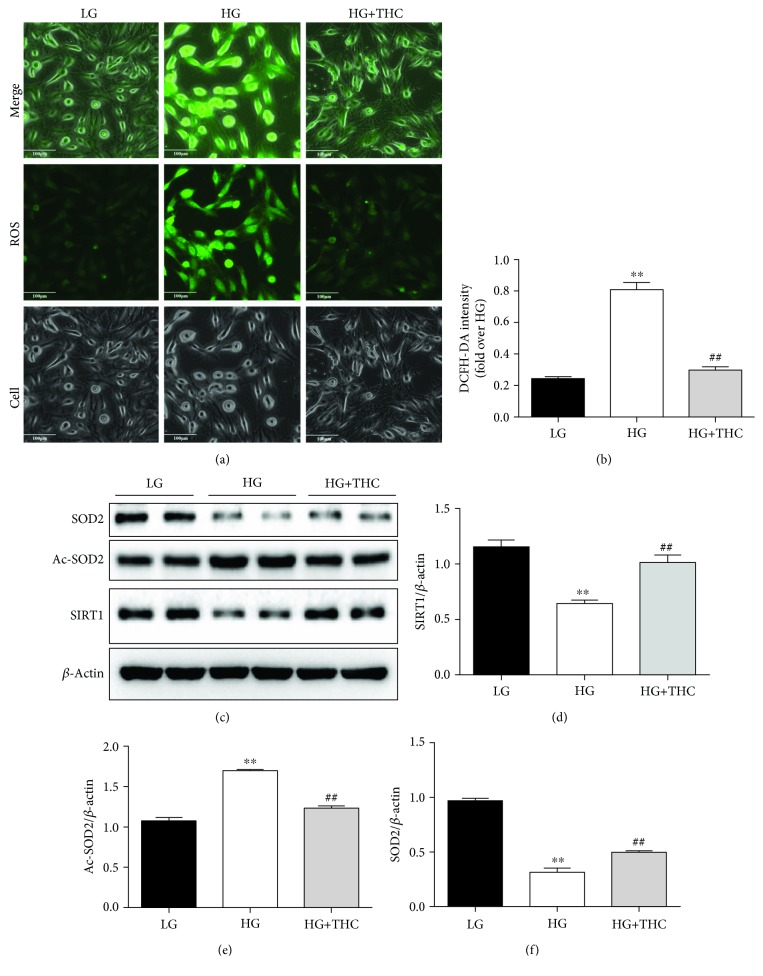
Figure 2.
THC reduces high glucose-induced ROS via activating the SIRT1 pathway in H9c2 cells. (a) Representative images of DCFH-DA staining (scale bar = 100 μm). (b) DCFH-DA intensity. (c) Representative blots of SIRT1, Ac-SOD2, SOD2, and β-actin. (d–f) Histogram shows the quantitative expression changes of SIRT1, Ac-SOD2, and SOD2; all of the proteins were normalized to β-actin before relative quantitative analysis, and all experiments were repeated 4 times independently. Data are presented as mean ± SEM. ∗/∗∗P < 0.05/0.01 versus the LG group; #/##P < 0.05/0.01 versus the HG group.

