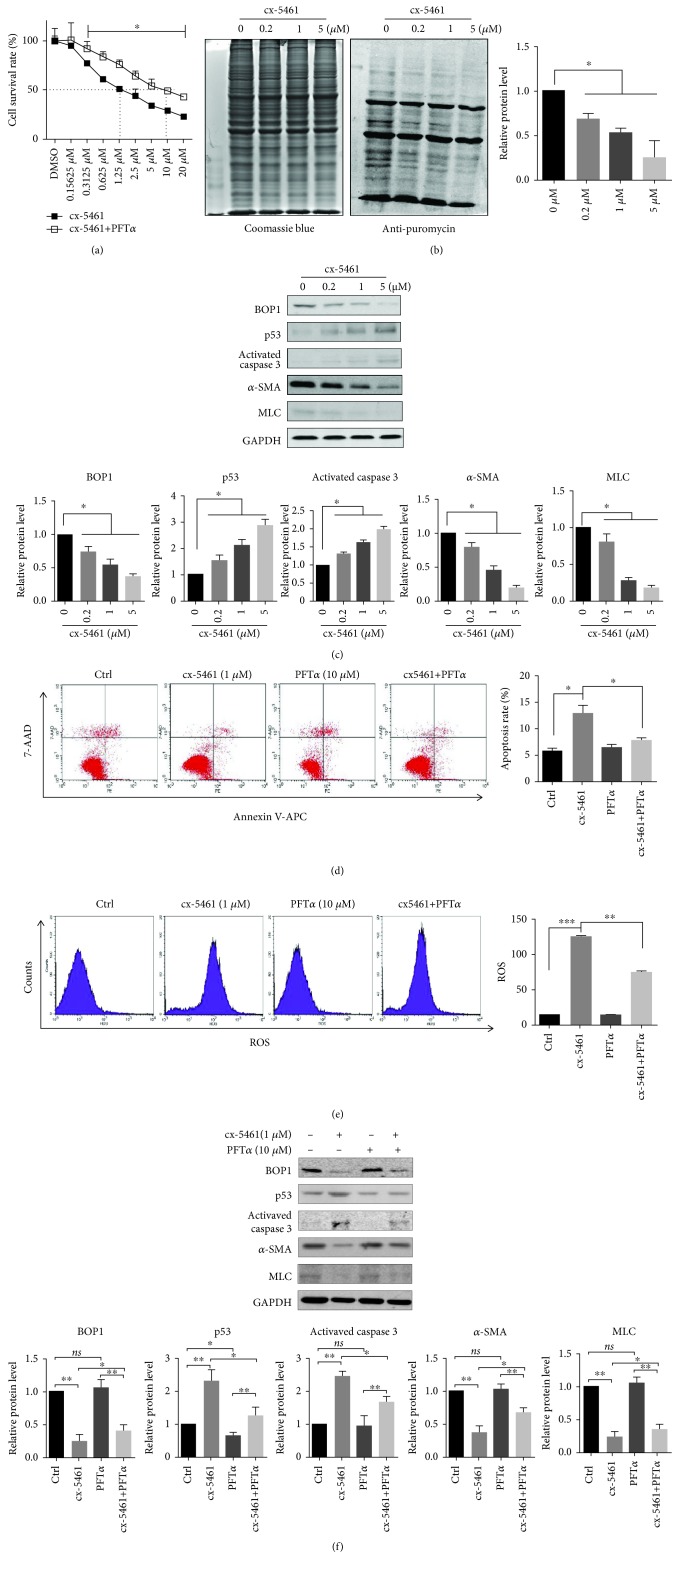
Figure 4.
cx-5461 impaired protein synthesis and activated p53-dependent cell apoptosis. (a) HASMCs were pretreated with or without PFTα (10 μM) for 12 h and then administrated with the indicated concentration of cx-5461 for 24 h. The cell survival rate was detected by CCK-8 assays. (b) HASMCs were treated with the indicated concentration of cx-5461 for 24 h and then administrated with puromycin (1 μM) for 40 min. The total protein (Coomassie blue staining, left panel) and the nascent protein (antipuromycin, middle panel) were shown. The statistical analysis of nascent protein/total protein is shown (right panel). (c) HASMCs were administrated with the indicated concentration of cx-5461 for 24 h. Western blotting was performed to detect the BOP1, p53, activated caspase 3, α-SMA, and MLC expression. Representative images are shown (left panel), and the grayscale was measured and detected by statistical analysis (right panel). (d) HASMCs were pretreated with or without PFTα (10 μM) for 12 h, followed by the treatment of cx-5461 (1 μM). Apoptosis was assessed by Annexin V-APC/7-AAD staining and flow cytometry (left panel). The statistical analysis of apoptosis rate is shown (right panel). (e) ROS were detected by DCFH-DA and flow cytometry (left panel). The ROS level is shown (right panel). (f) HASMCs were pretreated with or without PFTα (10 μM) for 12 h, followed by the treatment of cx-5461 (1 μM). Western blotting was performed to detect the BOP1, p53, activated caspase 3, α-SMA, and MLC expression. Representative images are shown (left panel), and the grayscale was measured and detected by statistical analysis (right panel). Data are representative of three independent experiments and presented as mean ± SD; ns: no statistical significance; ∗ P < 0.05, ∗∗ P < 0.01, determined by one-way ANOVA.

