Figure 2.
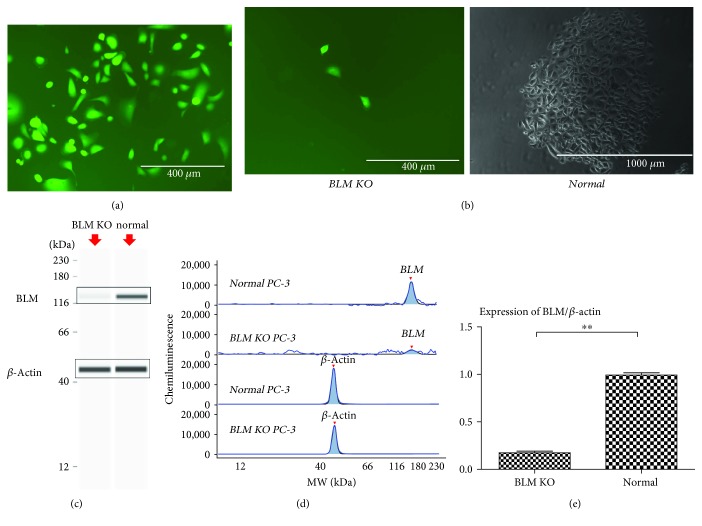
Site-directed knockout of the BLM gene in PC-3 cells. (a) PC-3 cells were observed under fluorescence microscopy following transfection with BLM CRISPR/Cas9 expression and donor vectors. (b) Monoclonal PC-3 cell clusters are shown after 3 weeks of culture. Normal PC-3 cells undergo monoclonal proliferation, while BLM KO PC-3 cells do not. (c) Expression of BLM in different PC-3 cell lines. Results were generated using the WES system. Band intensities represent protein expression. (d) Chemiluminescence was used to generate the peak area and molecular weight data by linear analysis using the WES system. (e) The BLM/β-actin ratio was significantly decreased in BLM KO PC-3 cells (∗ P < 0.01 and ∗∗ P < 0.01).

