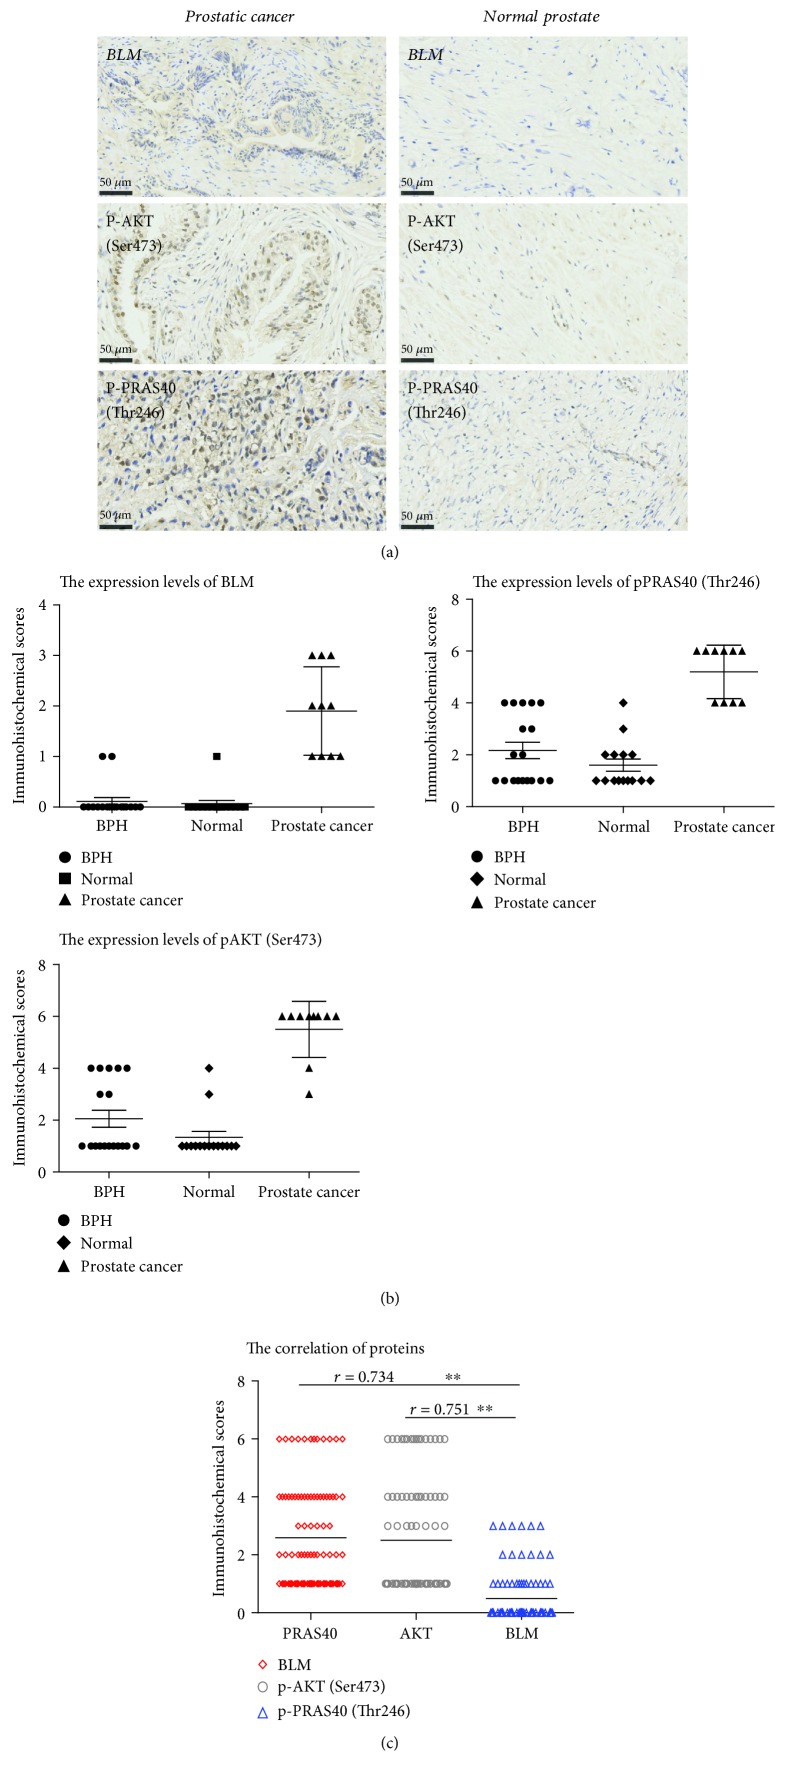
Figure 5.
Immunohistochemical analysis of phosphoprotein levels. (a) Prostate cancer tissue: weak BLM staining intensity (10-30% positive staining), moderate pAKT (Ser473) staining (50-70% positive staining), and moderate pPRAS40 (Thr246) staining (50-70% positive staining). Normal prostate tissue: negative BLM staining (0% positive staining), moderate pAKT (Ser473) staining (10-30% positive staining), and moderate pPRAS40 (Thr246) staining (10-30% positive staining). (b) Immunohistochemical scores were calculated based on the sum of the staining intensity scores and positive staining rates. Interpretation criteria were as follows: staining intensity score: 0 (-), 1 (weak), 2 (moderate), and 3 (strong). Positive staining rates were scored as follows: 0 (negative), 1 (1-25%), 2 (26%-50%), 3 (51-75%), and 4 (76%-100%). pAKT (Ser473), pPRAS40 (Thr246), and BLM expression in prostate cancer tissue was higher than in other tissues. (c) BLM expression positively correlated with pAKT (r = 0.751, P < 0.01) and pPRAS40 (Thr246) expression (r = 0.751, P < 0.01).

