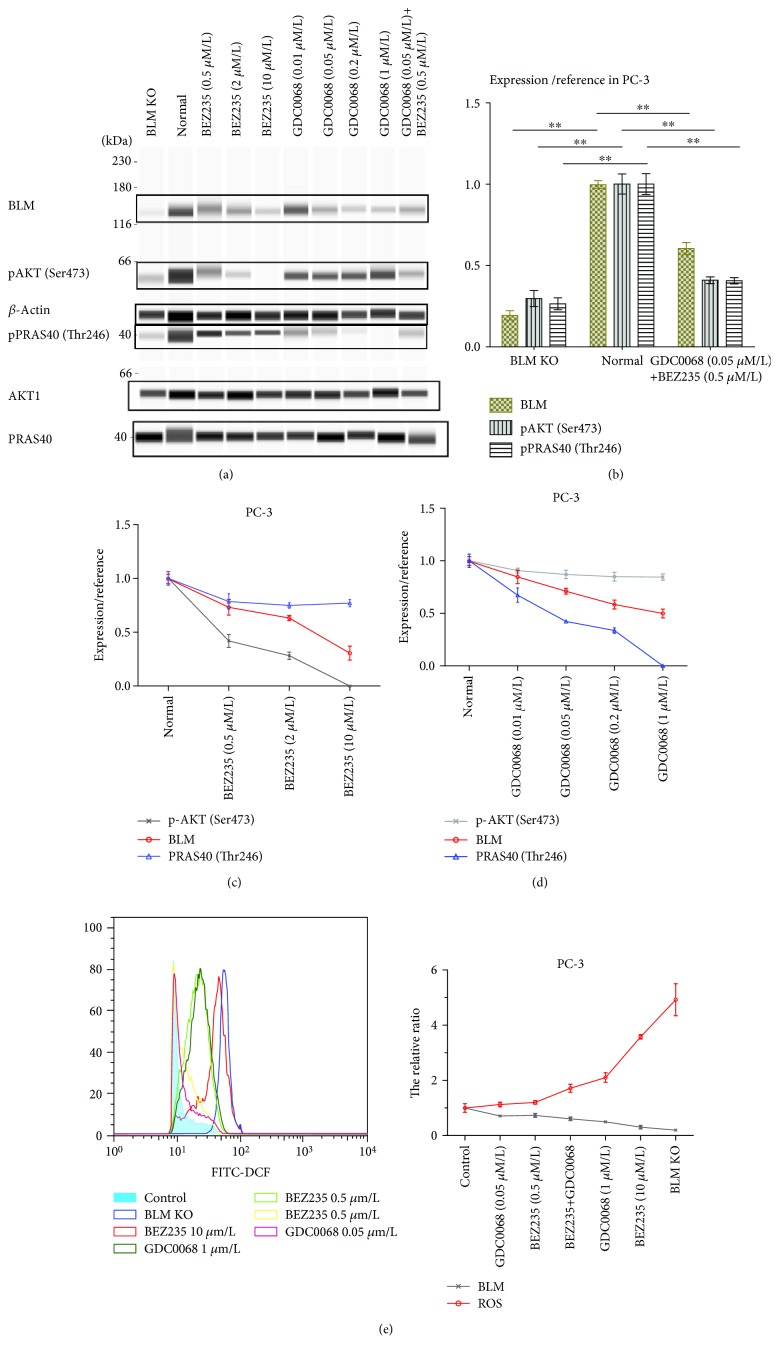
Figure 7.
BLM, pAKT, and pPRAS40 expression in PC-3 cells. (a) BLM helicase, pAKT, and pPRAS40 expression in PC-3 cells as measured by western blot and WES analysis. (b) Cells treated with BEZ235 and GDC-0068 displayed significantly reduced BLM expression, while BLM knockout decreased pAKT (Ser473) and pPRAS40 (Thr246) levels. BLM expression values were normalized to β-actin, and pAKT and pPRAS40 (Thr246) expression values were normalized to total AKT1 and PRAS40, respectively. Data represent the mean ± SD (∗ P < 0.05 and ∗∗ P < 0.01). BLM expression is positively correlated with (c) pAKT (P < 0.05) and (d) pPRAS40 levels (P < 0.01). (e) ROS production is negatively correlated with BLM expression (P < 0.05).

