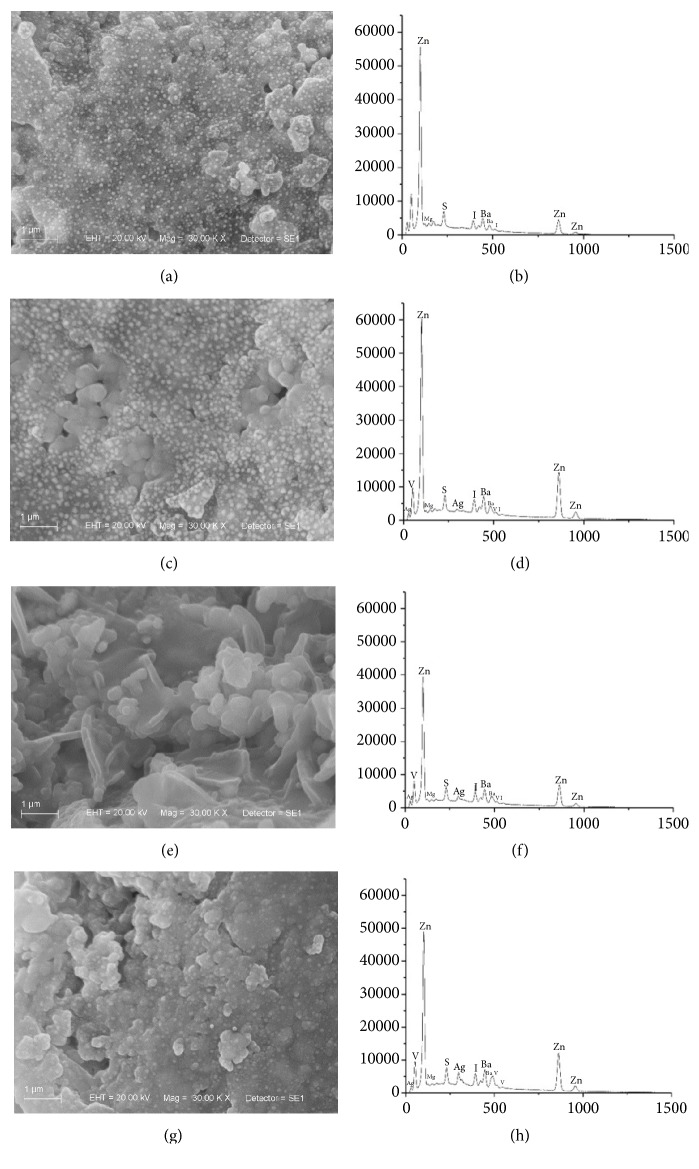
Figure 3.
Scanning Electron Microscopy (SEM) micrographs and energy-dispersive X-ray spectroscopy (EDS) analysis of the Endomethasone N. (a) Control group micrograph. (b) Control group EDS spectrum. (c) 2.5% of AgVO3 micrograph. (d) 2.5% of AgVO3 EDS spectrum. (e) 5% of AgVO3 micrograph. (f) 5% of AgVO3 EDS spectrum. (g) 10% of AgVO3 micrograph. (h) 10% of AgVO3 EDS spectrum.

