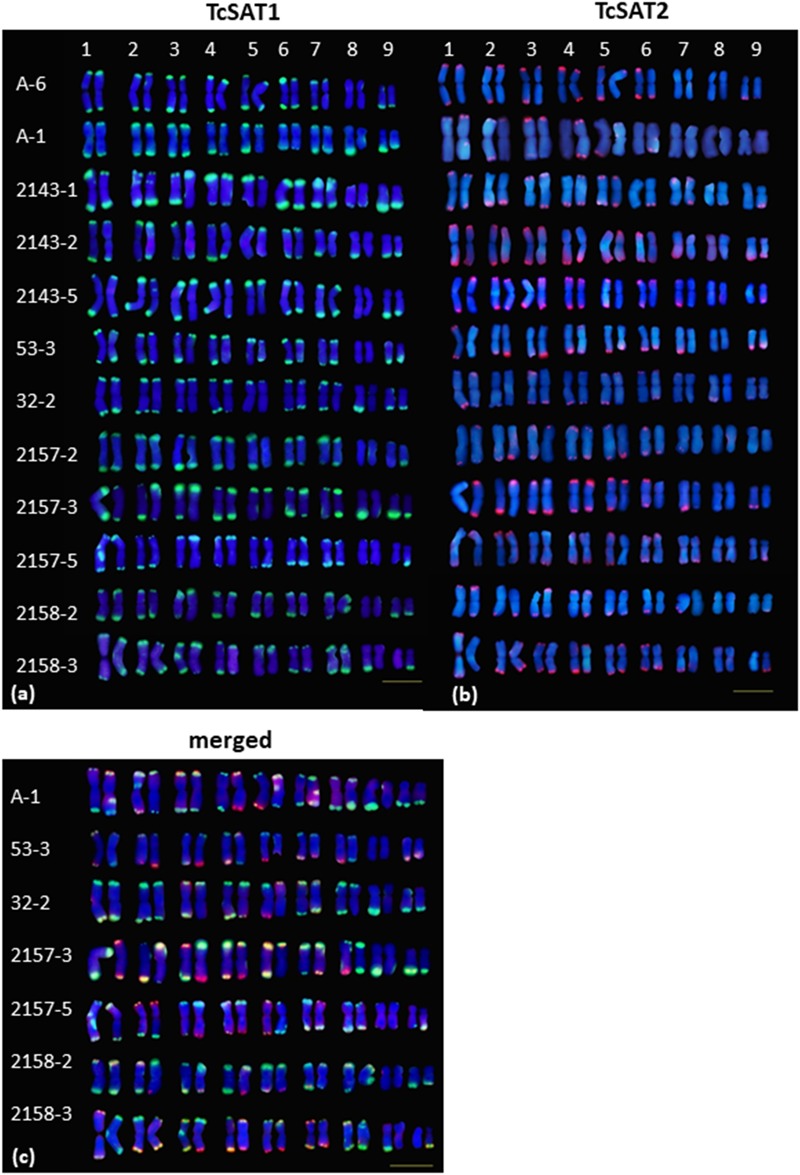
FIGURE 3.

Polymorphism of the TcSAT1 (green) and TcSAT2 (red) sites revealed by FISH. Homologous chromosome pairs were identified based on the morphology and FISH signal patterns and arranged according to their sizes. Accession number is left to the kariograms. Scale bar, 10 μm.
