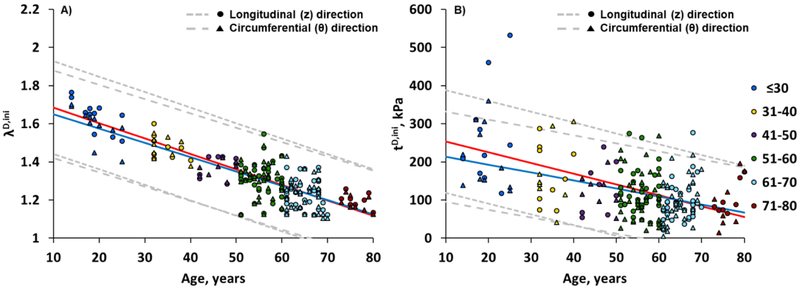
Fig. 3.
Change in longitudinal (z, red line) and circumferential (θ, blue line) damage initiation stretches (A) and Cauchy stresses (B) with age. The dashed gray lines represent the 5th and 95th percentiles for each direction. Damage initiation stretches can be described by linear functions −0.0081*age+1.7656 (R2 =0.73, longitudinal) and −0.0075*age+1.7253 (R2 =0.71, circumferential). Damage initiation stresses can be described by linear functions −2.82*age+282 (R2 =0.29, longitudinal) and −2.09*age+235 (R2 =0.21, circumferential).

