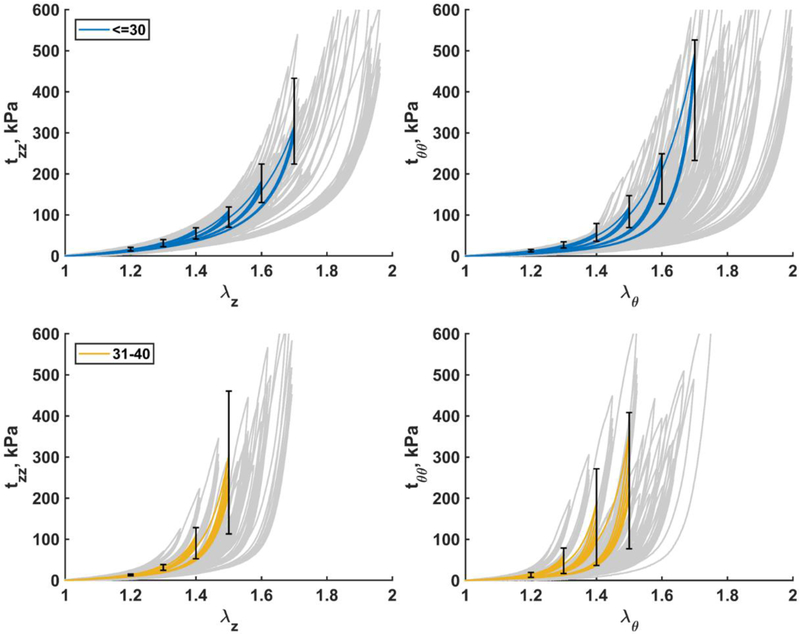
Fig. 6.
Mean Cauchy stress-stretch responses in the longitudinal (left) and circumferential (right) directions for the two youngest age groups (≤30 and 31–40 years old). Error bars correspond to the 25th and 75th percentiles when using the same stretch protocol. Grey curves in the background are experimental data.

