Fig 2.
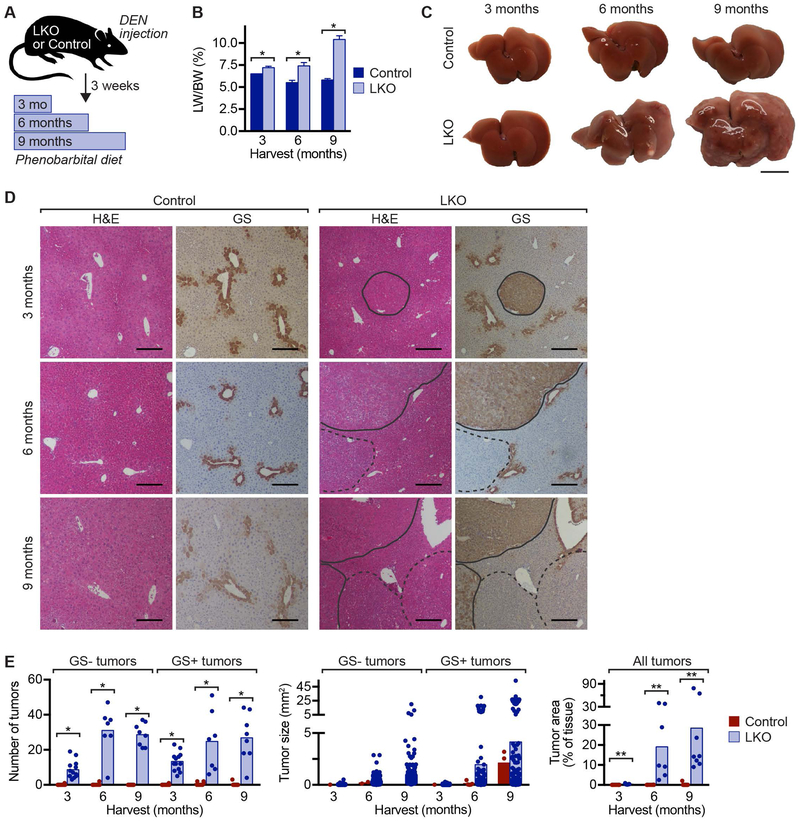
Liver tumors induced by the DEN model expand rapidly in LKO mice. (A) Experimental design is shown. Six-week-old LKO and control mice were injected with DEN (90 mg/kg) to induce liver tumors, and after 3 weeks, they were maintained on chow supplemented with 0.05% phenobarbital for 3, 6 or 9 months to promote tumor expansion (n = 7–9 mice/genotype/time point; males). (B) LW/BW was elevated in LKO mice at all time points. Graph shows mean ± sem. (C) Control livers contained no macroscopic tumors after 3–9 months. In LKO livers, there were few macroscopic tumors at 3 months, and they increased in size and number over time. Gross morphology is shown for representative livers. (D) Serial liver sections were stained with H&E and GS (brown) to identify liver tumors. GS- tumors (dashed line) and GS+ tumors (solid line) are indicated. (E) Compared to controls, tumors in LKO mice were more numerous (left), larger in size (middle) and occupied more liver tissue (left). Graphs show mean and dots represent individual mice (for tumor number and tumor area) or individual tumors (for tumor size). * P < 0.002, ** P < 0.0008. Scale bars are 1 cm (in C) or 200 μm (in E).

