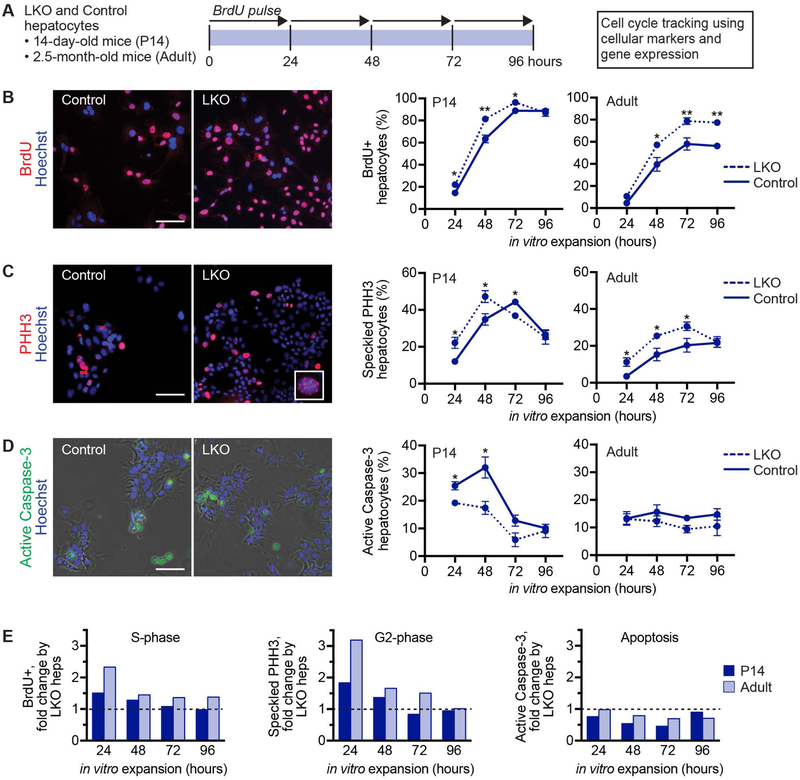
Fig. 3.
LKO hepatocytes that are predominantly diploid cycle faster than control hepatocytes. (A) Experimental design is shown. LKO and control hepatocytes isolated from 14-day-old (n = 3–5/genotype/time point) or 2.5-month-old mice (n = 4–6/genotype/time point; female) were seeded in cell culture dishes and harvested after 24, 48, 72 or 96 hours of proliferation to determine S-phase via BrdU incorporation, G2-phase via speckled PHH3 staining and apoptosis via active caspase-3 staining. For BrdU incorporation, cells were pulsed with BrdU for 24 hours prior to harvest. (B-D) Representative images are shown for cells after 72 hours in culture. Cells were stained for BrdU (red) (B), PHH3 (red, inset shows speckled staining pattern) (C) and active caspase-3 (green, overlaid with phase contrast) (D). Nuclei were stained with Hoechst dye (blue). Graphs show the percentage of positive cells at each time point; see Supporting Fig. S6 for the percentage of positive nuclei. (E) LKO proliferation kinetics by hepatocytes isolated from 14-day-old mice were compared to 2.5-month-old mice by calculating the fold-change of LKO hepatocytes in each phase of the cell cycle versus control values. The dashed lines indicate a normalized value of 1. * P < 0.04, ** P < 0.008. Graphs show mean ± sem (B-D) or mean only (E). Scale bars are 100 μm.

