Fig. 4.
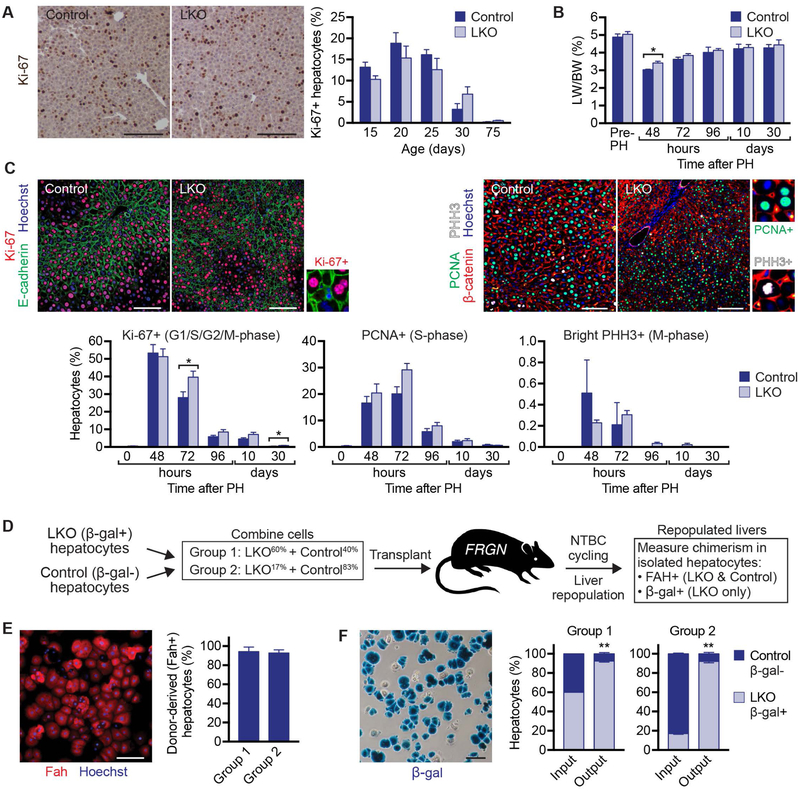
LKO hepatocytes proliferate faster than controls during liver regeneration and repopulation. (A) LKO and control livers harvested during postnatal development (15, 20, 25 and 30 days) and in adults (75 days), were stained for Ki-67 (brown) as a marker for proliferation (n = 4–5 mice/genotype/age; mixed gender). Representative micrographs are shown for 20-day-old mice (left), and percentage of Ki-67+ hepatocytes is shown for all ages (right). (B-C) Two-thirds PH was performed on 2.5-month-old LKO and control mice to induce liver regeneration. Livers were harvested before PH and at the indicated time points after PH (n=3–8 mice/genotype/age; mixed gender). LW/BW is shown (B). On the left, liver sections were stained with Ki-67 (red), E-cadherin (green, to mark cell membranes) and Hoechst (blue, to mark nuclei). On the right, liver sections were stained with β-catenin (red, to mark cell membranes), PCNA (green), PHH3 (white) and Hoechst (blue, to mark nuclei). Representative images are shown 48 hours after PH, and magnified insets depict Ki-67+ (G1/S/G2/M-phase), PCNA+ (S-phase) and bright PHH3+ (M-phase) nuclei. The percentage of hepatocytes in each phase of the cell cycle for all time points is indicated (bottom) (C). (D-F) Liver repopulation was compared using competitive transplantation. Hepatocytes from 2.5-month-old male LKO and control mice were mixed in defined ratios and transplanted into FRGN recipients. Group 1 contained 60% LKO and 40% control (n = 5 recipients); Group 2 contained 17% LKO and 83% control (n = 7 recipients). Mice were cycled off/on NTBC for ~3 months to promote expansion of donor cells. Following completed liver repopulation, hepatocytes were isolated and chimerism was determined. Cartoon shows the experimental design (D). Isolated hepatocytes were heterogeneous, containing Fah+ donor cells (LKO and control) and Fah- recipient cells and the degree of repopulation was determined by Fah staining. Representative staining is shown for a repopulated recipient from Group 1 (Fah, red and Hoechst, blue), and the graph shows the percentage of Fah+ cells in each group (E). Hepatocytes were stained with X-gal to visualize β-gal (blue). Representative image is shown for a repopulated recipient from Group 1. The graphs summarize the percentages of β-gal- and β-gal+ hepatocytes at the time of transplant (marked as “input”) and after liver repopulation (marked as “output”) (F). See Supporting Fig. S7 for data from individual recipients. * P < 0.03, ** P < 0.001. Graphs show mean ± sem. Scale bars are 100 μm.

