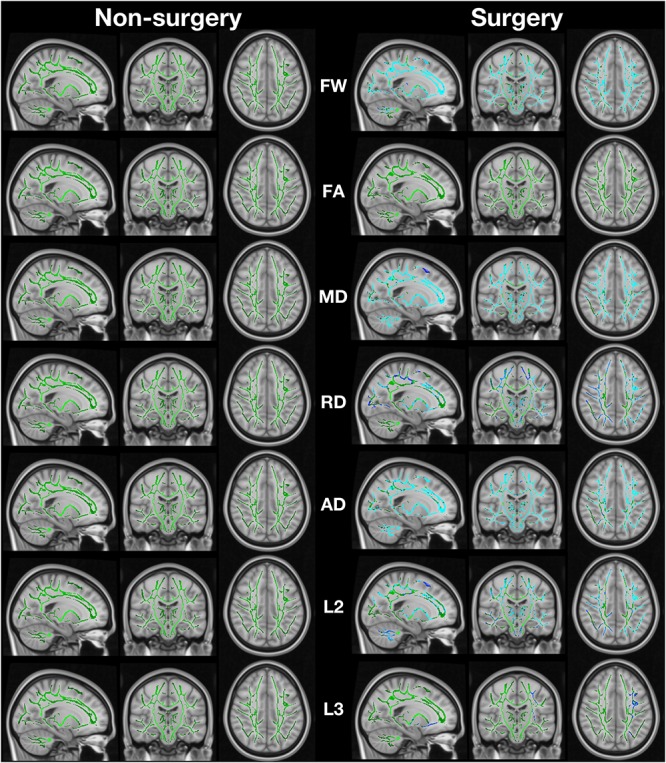
FIGURE 1.

Image shows regions of change in fractional anisotropy (FA), mean diffusivity (MD), radial diffusivity (RD; calculated as the mean of λ2 and λ3), axial diffusivity (AD; calculated as λ1), λ2 (L2), and λ3 (L3). The green regions are the white matter skeleton created by TBSS. Blue indicates regions where post > pre. Non-surgery participants had no areas of significant change while surgery participants had extensive change (FSL randomise paired t-test with 5000 permutations).
