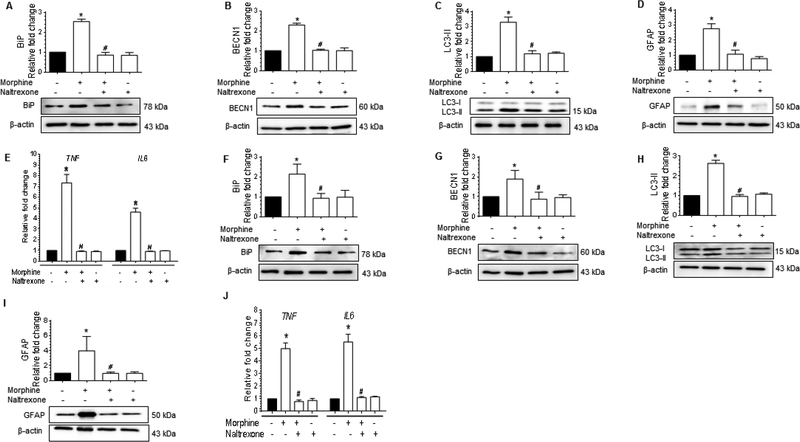
Figure 6.
Morphine-mediated defective autophagy involves MOR in astrocytes.(A-D)Representative western blots showing the protein levels of BiP (A), BECN1 (B), LC3-II (C), and GFAP (D) in human A172 astrocytoma cell line pretreated with 100 μM naltrexone for 1 h followed by 500 nM morphine exposure for 24 h. (E) qPCR showing the relative expression of proinflammatory cytokines such as TNF and IL6 mRNA in human A172 astrocytoma cell line pretreated with 100 μM naltrexone for 1 h followed by 500 nM morphine exposure for 24 h. (F-J)Representative western blots showing the protein levels of BiP (F), BECN1 (G), LC3-II (H), and GFAP (I) in human primary astrocytes pretreated with 100 μM naltrexone for 1 h followed by 500 nM morphine for 12 h. (J) qPCR showing the relative expression of proinflammatory cytokines such as TNF and IL6 mRNA in human primary astrocytes pretreated with 100 μM naltrexone for 1 h followed by 500 nM morphine for 12 h. β-actin was used as a loading control for western blot and GAPDH for mRNA expression of cytokines. Data are presented as mean ± SEM; n = 4. Non-parametric Kruskal-Wallis One-way ANOVA followed by Dunn’s post hoc test was used to determine the statistical significance between multiple groups: *, P<0.05 vs. control; #, P<0.05 vs. morphine.

