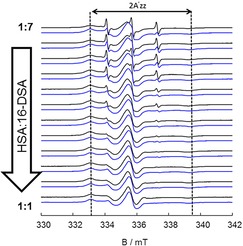
Figure 5.

The EPR spectra of a healthy individual (blue) and purified HSA (black) are compared. Deviations from purified HSA (in black) could be observed in terms of high amount of free component and variation in population of binding sites (A) and (B). With an exception to1 : 4 loading ratio, no big changes in 2A′zz could be seen.
