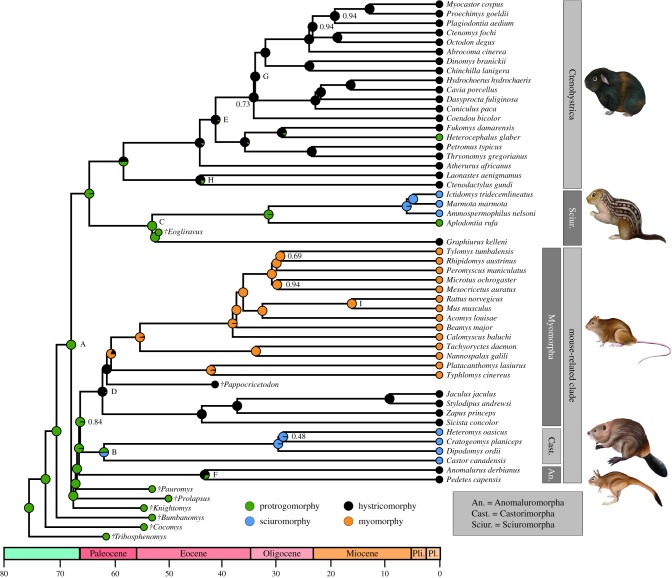
Figure 2.
A time-calibrated, family-level phylogeny of rodents, showing the masseter muscle character states of extant and fossil taxa as well as the probability of each state at ancestral nodes based on the ordered ARD model. Character states correspond to masseter architecture shown in figure 1. Numbers at nodes indicate bootstrap support less than 100 and letters at nodes correspond to fossil constraints from table 1. ‘Pli.’ denotes the Pliocene epoch and ‘Pl’ denotes the Pleistocene epoch on the timeline. Outgroups Ochotona princeps and Oryctolagus cuniculus were pruned out prior to stochastic character mapping analysis.

