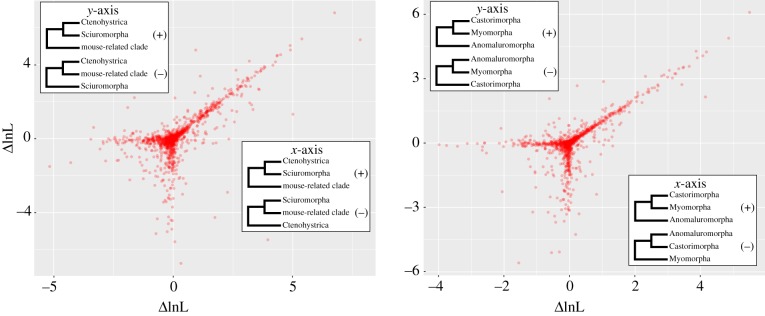
Figure 3.
Plots of per-locus ΔlnL values for the comparison of figure 2 topology (supported by RAxML concatenation and ASTRAL) with alternative topologies at two nodes of interest showing low magnitude values and no outlying clusters of loci. Positive values indicate support for figure 2 topology while negative values indicate support for an alternative hypothesis. (Online version in colour.)

