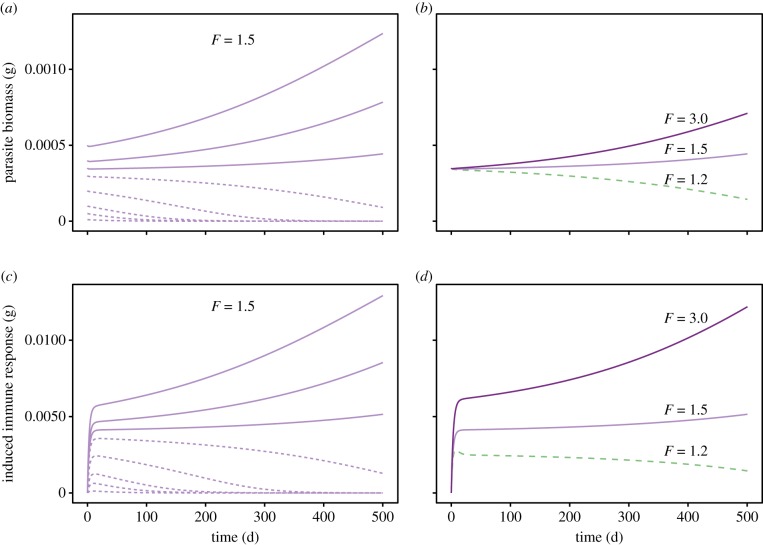
Figure 1.
Parasite biomass and induced immune response in time series starting from various initial conditions. Simulation of infections starting at eight different doses (a,c), and starting at different host food availability levels (b,d). σC = 0.52, other parameters have default values (electronic supplementary material, table S1). Only the first 500 time steps of the integration are shown, see electronic supplementary material, figure S4 for the extended time series with full transient dynamics up to the attractor states and for the dynamics of other system variables. (Online version in colour.)

