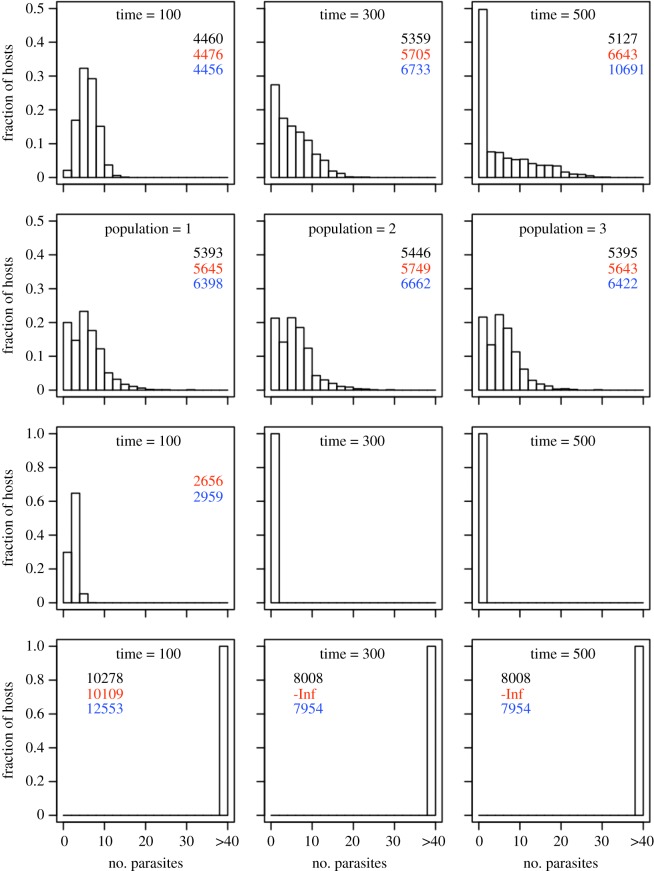
Figure 2.
Distribution of parasite burdens under different scenarios. For each scenario, 1000 hosts were infected with a parasite dose randomly drawn from a normal distribution with mean of 3 × 10⁻⁴ g and standard deviation of 8 × 10⁻⁵ g. With the default value σC = 0.52, this distribution centres around the unstable equilibrium in figure 3c. All parameters have default values (electronic supplementary material, table S1); to convert biomass into parasite numbers, we used the mass of an adult worm of 5 × 10⁻⁵ g. First scenario: every host is sampled at the same infection age (top row). Second scenario: each host is sampled at a different infection age, as in sampling a natural population (second row), which was repeated three times to simulate sampling three different populations. Third scenario: σC = 0.45, only acute infections are possible (third row). Last scenario: σC = 0.9, only chronic infections are possible (bottom row). Legend in panels: AIC scores from fitting different statistical distributions to distribution data using the ‘fitdistr’ function (MASS package in R; black—negative binomial, red—normal, blue—Poisson). (Online version in colour.)

