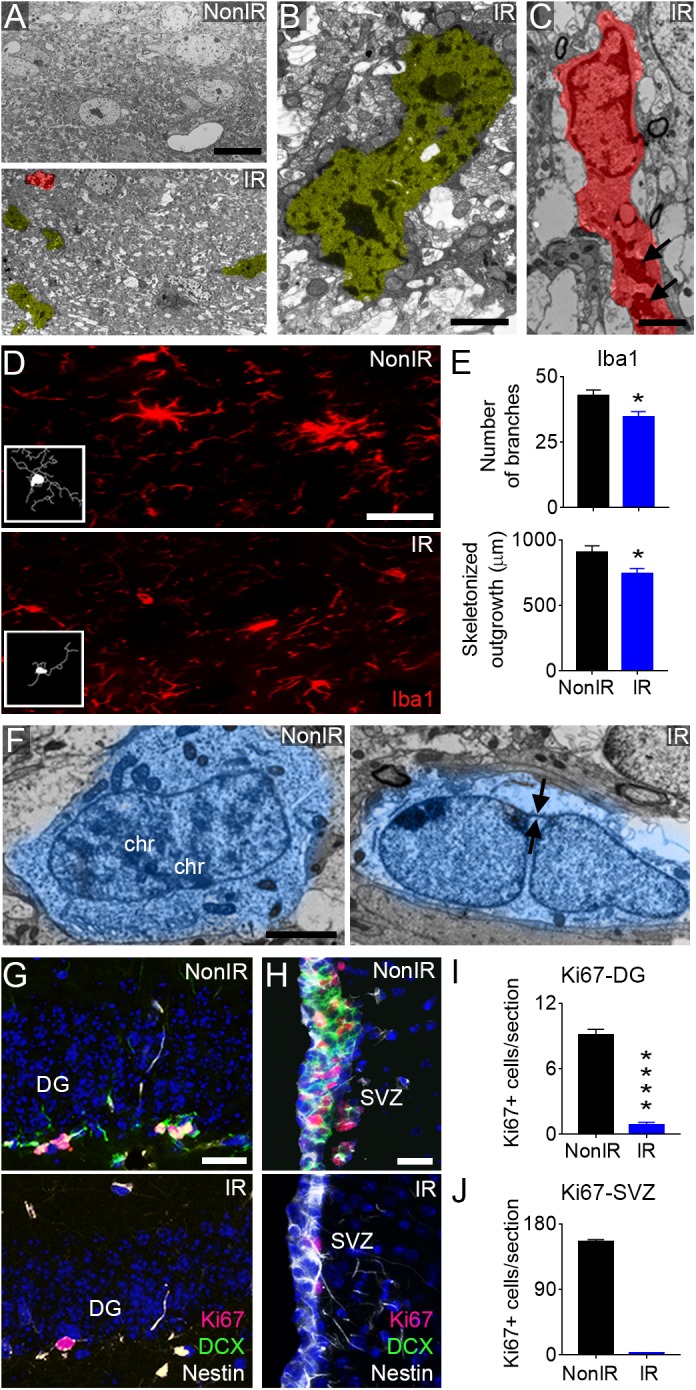
FIGURE 1.

Radiation induces anatomical changes in the mouse brain. Representative images of radiation-induced damages in the mouse brain 30 days post-radiation (total dose of 10 Gy). (A) Electron microscopy micrograph showing multiple pyknotic cells (yellow) and microglia (red) in the irradiated brain, compared to non-irradiated mice. (B) High magnification of a pyknotic cell in the irradiated brain. (C) High magnification of a microglia cell in the irradiated brain displaying round shape and abundant dense bodies (arrows) in the cytoplasm. (D) Immunofluorescence against Iba1 reveals the presence of ramified microglia (resting cells) in the non-irradiated brain and bushy microglia (activated cells) in the irradiated brain. (E) Quantification of the number of branches and total length of processes (skeletonized outgrowth) in Iba1 expressing cells. (F) Representative images showing the presence of a NSC with condensed chromosomes (chr) in the non-irradiated SVZ and a quiescent NSC identified by the presence of envelope-limited chromatin sheets (arrows) in the irradiated SVZ. (G) Immunofluorescence against Ki67, Nestin, and DCX in the irradiated DG. (H) Immunofluorescence against Ki67, Nestin, and DCX in the irradiated SVZ. (I) Quantification of Ki67+ cells in the DG. (J) Quantification of Ki67+ cells in the SVZ. IR, irradiated mice; NonIR, non-irradiated mice. Scale bar: (A) 10 μm, (B,C) 2 μm, (D) 50 μm, (F) 2 μm, (G) 25 μm, (H) 200 μm. Data are represented as mean ± SEM. n = 5 per group, ∗p < 0.05, ∗∗∗∗p < 0.0001; t-test.
