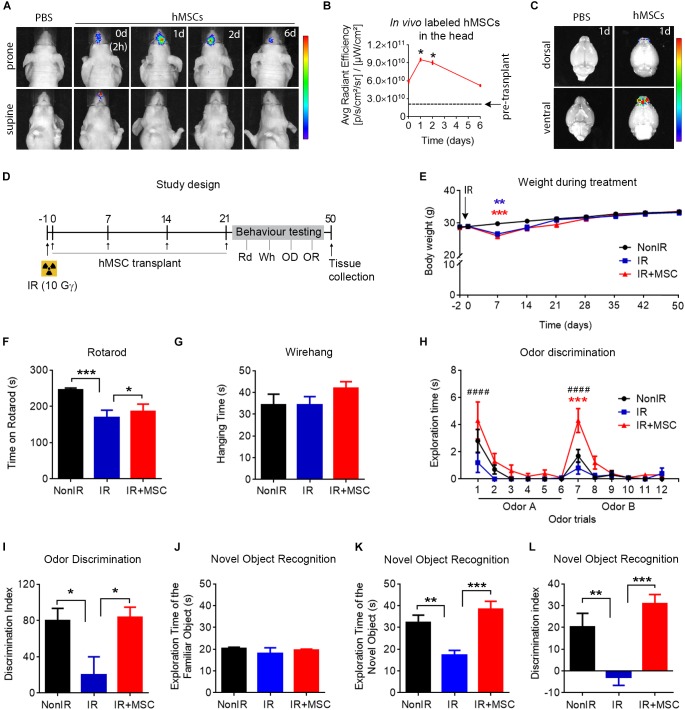
FIGURE 2.
Transplanted hMSCs improved neurological function after whole-brain radiation. (A) Representative images showing in vivo fluorescence signal in the head at 2 h, 1 day, 2 days, and 6 days after the first intranasal cell delivery (5 × 10⁵ hMSCs). (B) Quantification of the in vivo fluorescence signal in the head within the first 6 days post transplantation, compared to day 0 (2 h after hMSC delivery). (C) In vivo fluorescence signal in dissected brains 1 day after intranasal delivery of hMSCs. (D) Schematic representation of the study design. Mice received whole-brain radiation (total dose of 10 Gy). Twenty-four hours after radiation, 5 × 10⁵ cells hMSCs were administered intranasally once per week for 4 weeks. Then, mice were tested in a behavioral test battery (Rotarod, Rd on days 33–34; Wirehang, Wh on day 35; Odor discrimination task, OD on day 37; Novel Object Recognition test, OR on days 40–44) before being sacrificed. (E) Body weight during the course of the experiment revealing a temporary weight loss in irradiated mice (receiving or not hMSCs) the week after radiation exposure. (F) Rotarod test performance showing an improvement in IR+MSC mice, as compared to IR mice. (G) Wirehang test performance showing no differences between any experimental group. (H) Time spent sniffing the stimuli (Odor A and Odor B) in an odor discrimination task. (I) Discrimination index of Odor A and Odor B (presentation 6 vs. presentation 7), showing a rescued OD performance in IR+MSC mice. (J) Exploration time of the familiar object in the Novel Object Recognition test. (K) Exploration time of the novel object in the Novel Object Recognition test. (L) Discrimination index between familiar and novel object, showing a rescued OR performance in IR+MSC mice. Data are represented as mean ± SEM. n = 3 per group (B), n = 10–15 per group (E–L). Comparisons of IR or IR+MSC versus Non-IR are indicated with ∗. Comparisons of IR+MSC versus IR are indicated with #. ∗p < 0.05, ∗∗p < 0.01, ∗∗∗p < 0.001, ∗∗∗∗p < 0.0001, ####p < 0.0001; One-way ANOVA (B,F,G,I–L), Two-way repeated-measures ANOVA (E,H). Rainbow color scale: red indicates highest fluorescence signal and blue indicates lowest fluorescence signal.

