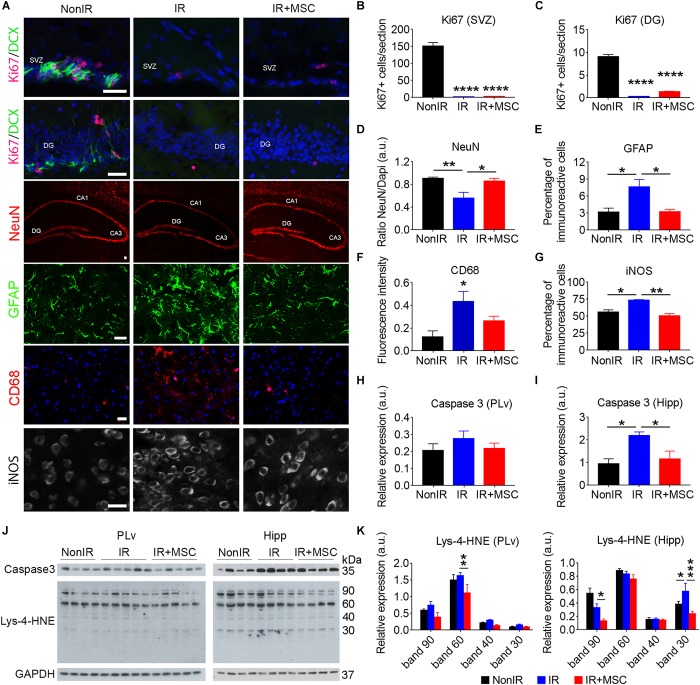
FIGURE 5.
hMSCs protected from neural cell loss, inflammation and oxidative stress. (A) Immunofluorescence analysis in the brain of NonIR, IR and IR+MSC mice, using Ki67, DCX, NeuN, GFAP, CD68 and iNOS markers (n = 3–5 per group). (B) Quantification of Ki67 positive cells in the SVZ. (C) Quantification of Ki67 positive cells in the DG. (D) Quantification of NeuN immunoreactive area in the Hipp. (E) Quantification of the percentage of GFAP immunoreactivity in the striatum. (F) Quantification of the CD68 immunoreactivity in the cortex. (G) Quantification of iNOS immunoreactivity in the striatum. (H) Densitometric quantification of Caspase 3 expression by western blot in the PLv. Western blot images are shown in panel (J). (I) Densitometric quantification of Caspase 3 expression by western blot in the Hipp. Western blot images are shown in panel (J). (J) Representative western blots of Caspase 3 and Lys-4-HNE from PLv and Hipp tissue lysates (n = 4–5 per group). (K) Densitometric quantification of Lys-4-HNE levels by western blot in PLv and Hipp tissue lysates. Scale bar 25 μm. Data are represented as mean ± SEM. ∗p < 0.05, ∗∗p < 0.01, ∗∗∗p < 0.001, ∗∗∗∗p < 0.0001; One-way ANOVA (B–I), Two-way ANOVA (K).

