An official website of the United States government
Here's how you know
Official websites use .gov
A
.gov website belongs to an official
government organization in the United States.
Secure .gov websites use HTTPS
A lock (
) or https:// means you've safely
connected to the .gov website. Share sensitive
information only on official, secure websites.

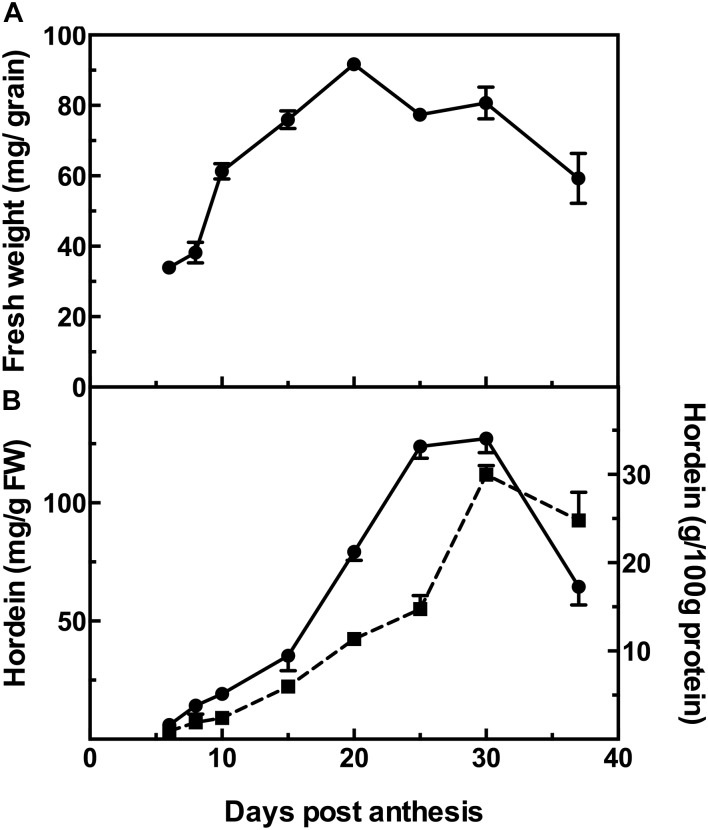
 , left y-axis), or as g/100 g protein (
 , right y-axis). Mean (n = 4) ± SE are shown; no error bars are shown when SE < symbol size.