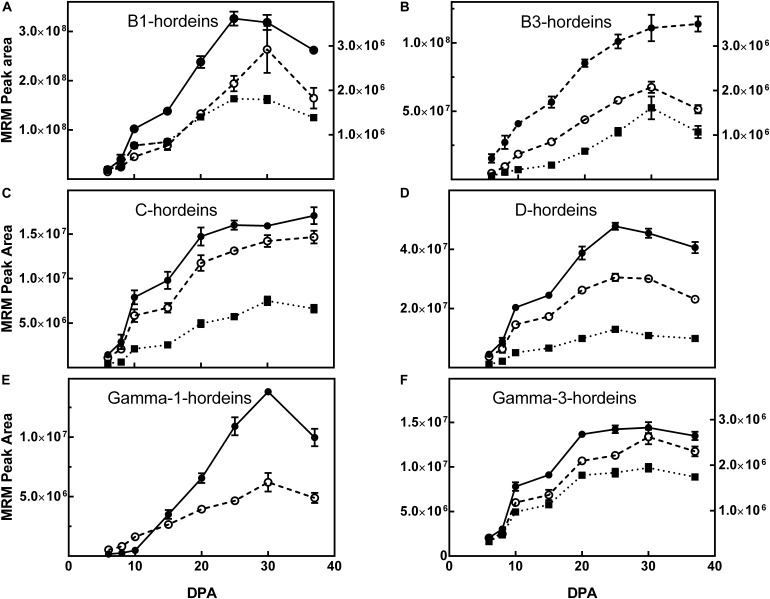
FIGURE 5.
The effect of maturity (days post-anthesis, DPA) on the accumulation of representative hordein family-specific peptides following chymotrypsin cleavage. The mean multiple reaction monitoring (MRM) peak area ± SE (n = 3) from 5 μg extracted protein is shown for peptides mapping to: (A) B1-hordeins P06470-C1 ( , right y-axis), P06470-C2 (
 , left y-axis), and P06470-C3 (
 , right y-axis); (B): B3-hordeins I6SW30-C1 (
 , left y-axis), I6SJ26-C1
  , right y-axis), I6SJ26-C2 (
 , left y-axis); (C) C-hordeins Q40053-C1 (
 ), Q40053-C3 (
 ) and Q41210-C4 (
 ); (D) D-hordein I6TRS8-C1 (
 ), I6TRS8-C5 (
 ) and I6TRS8-C6 (
 ); (E) γ1-hordein TC131355-C1 (
 ), γ1-hordein I6TMV6-C1 (
 ); (F) γ3-hordein I6TEV2-C1 (
 , left y-axis), γ3 I6TEV2-C2 (
 , right y-axis), and γ3 I6TEV2-C3 (
 , right y-axis). The sequence of the proteins and peptide markers are shown in Supplementary Table S4. Where the SE is less than symbol size it is not shown. For clarity, symbols of significance are not shown but where points differ by 2 × SE they are significantly different. Detailed statistical comparisons are shown in Supplementary Figures.

