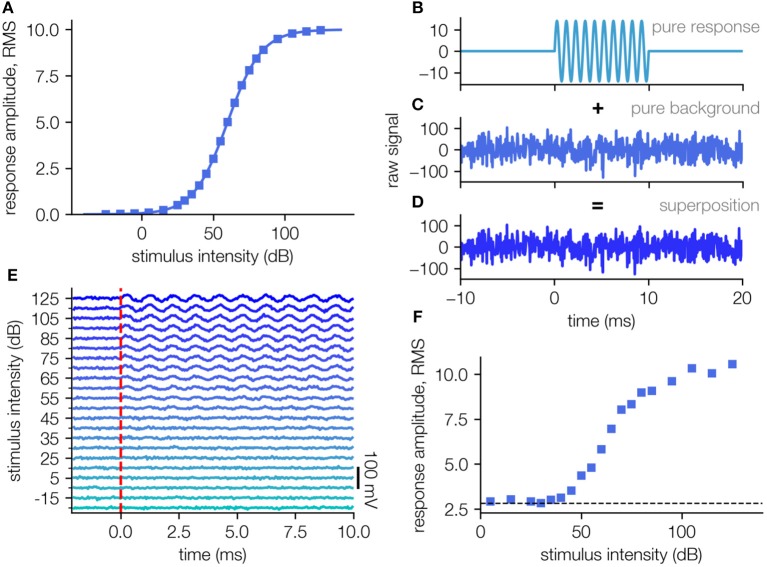
Figure 1.
Generation of artificial test data sets. (A) Template amplitude response function used to generate the artificial field potential. (B) The stimulus response is simulated as a sine-wave of frequency 1,000 Hz and a duration of 10 ms (impulse response to short stimulus). (C) The measurement noise is modeled as Gaussian white noise with an RMS amplitude 4 times higher than the maximal simulated response. (D) The artificial signal is a superposition of the simulated response and the simulated background noise. (E) Simulated neuronal signal (e.g., ABR waves superposed with background noise), each averaging 200 single trials (D). (F) Response intensity function for the simulated data set in (E). The RMS of the background alone (dashed line) is being ~2.8.

