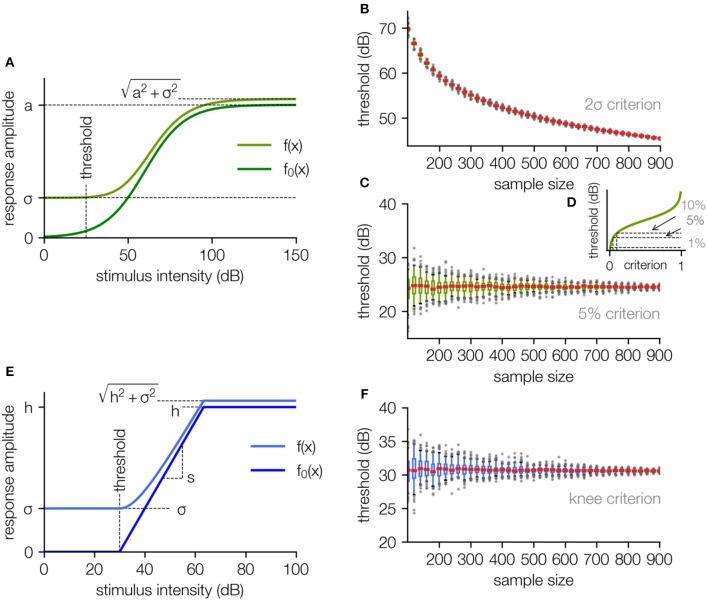
Figure 2.
The fit function based on a generalized logistic function. (A) The stimulus response function without background noise is approximated using a generalized logistic function (dark green). The fit function (light green) is the square root of the sum of the squared “pure” neuronal signal and the squared noise amplitude (including neural noise and measurement noise, for the derivation cf. Supplementary 2). (B) The estimated threshold for the 2σ-criterion as a function of the number of applied data samples decreases monotonically with rising sample size and diverges to −∞ for an infinite number of samples. (C) The estimated threshold for the 5% criterion is independent of the sample size, only the uncertainty decreases (estimated by subsampling, cf. Methods). (D) Different choices of the threshold parameter p for this criterion result in different threshold estimates. (E) To get rid of the arbitrary parameter p, the sigmoid shape of the stimulus response function can be approximated with a hard sigmoid function (dark blue), where the threshold is defined as the lower knee. In analogy to the logistic function, for fitting the responses the function is superimposed with a noise offset sigma. (F) Estimated threshold for the knee criterion as a function of the sample size. The small constant offset compared to the analysis in (C) is caused by the arbitrary parameter p used for the 5% criterion. The analysis in (B,C,F) was performed by stepwise subsampling with increasing sample size N, with 100 subsamples for each size.

