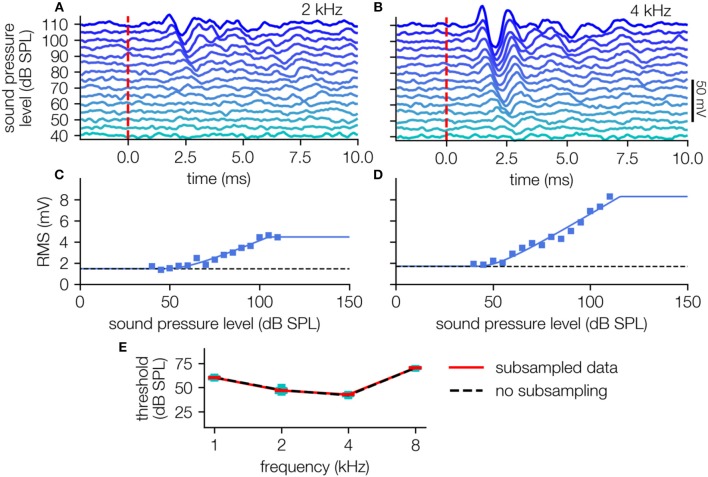
Figure 4.
ABR-data analysis. (A,B) ABR waves (40–110 dB SPL, cyan to blue) of one animal (2, 4 kHz pure tone stimuli) averaged over 240 single trials (i.e., 120 double trials). (C,D) Level response function (blue markers) approximated using the hard sigmoid fit (blue line). (E) Audiogram with variances determined by subsampling (black dashed line: no subsampling, red line: medians, cyan boxes: quartiles, whisker 5–95% percentiles, subsampling: N = 200 out of 240 trials).

