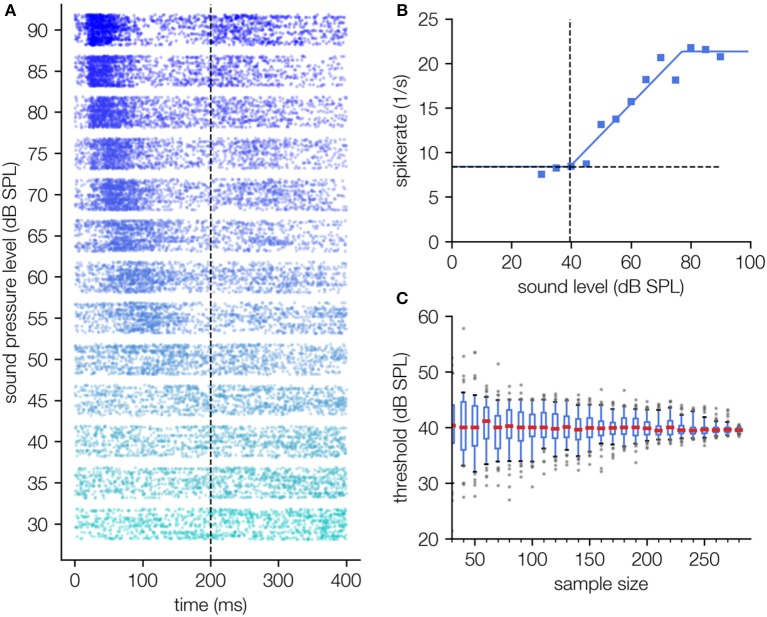
Figure 6.
Threshold determination using single unit spiking data recorded in the auditory cortex. (A) Dot raster diagram of the measured spikes (timestamps of spikes) for different stimulus intensities of a 2 kHz pure tone (30–90 dB SPL, onset 0 ms, offset 200 ms) and 300 measurement repetitions. The typical latency shift as a function of the applied sound pressure level can be observed. (B) Hard sigmoid fit; For this fitting procedure the function f0(x) + σ is fitted in contrast to LFP recordings where the fit function is . This difference arises from the fact that spontaneous spike rate and evoked spike rate can simply be added. Thus, the hard sigmoid added by the spontaneous activity term are a good description of the level response characteristics (B). (C) The determined threshold shows no systematic dependency on the number of measurement repetitions.

