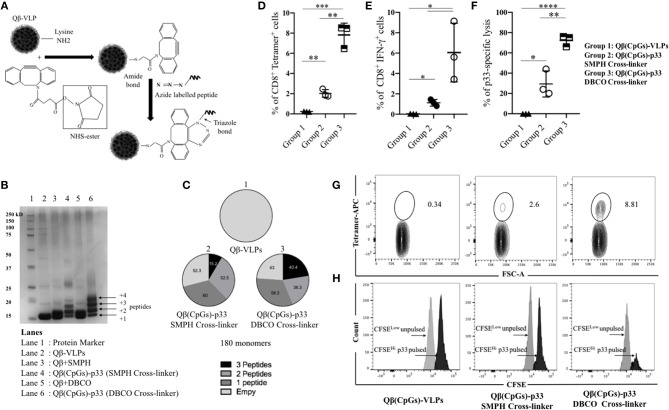
Figure 2.
Bio-orthogonal Cu-free click chemistry; an efficient method for coupling antigens to VLPs to enhance their immunogenicity. (A) A sketch illustrating the coupling method using Bio-orthogonal Cu-free click chemistry (dibenzocyclooctyne NHS ester DBCO). Briefly, NHS ester reacts with Lys residues on VLPs and incorporates a cyclooctyne moiety which reacts with the azide labeled molecule forming a stable triazole linkage. (B) SDS-PAGE stained with coomassie blue showing the coupling efficiency of p33 to Qβ(CpGs)-VLP using SMPH cross-linker or DBCO cross-linker. Lane 1 protein marker, lane 2 Qβ-VLP monomer, lane 3 Qβ(CpGs)-VLP derivatized with SMPH cross-linker, lane 4 Qβ(CpGs)-p33 vaccine using SMPH cross-linker, lane 5 Qβ(CpGs)-VLP derivatized with DBCO cross-linker, lane 6 Qβ(CpGs)-p33 vaccine using DBCO cross-linker. Each extra band in lanes 4 and 6 indicates a peptide binds to a Qβ monomer. (C) Densitometric analysis of SDS-PAGE lanes 1, 4, and 6. (1) uncoupled Qβ-VLP, total 180 monomers, (2) Qβ(CpGs)-p33 vaccine using SMPH cross-linker, and (3) Qβ(CpGs)-p33 vaccine using DBCO cross-linker. Notice the percentage of the coupled peptides to Qβ-VLP monomers, total 180 monomers. (D) Percentage of CD8+ Tetramer+ cells (means ± SEM) in the spleen of vaccinated groups: group 1) Qβ(CpGs)-VLPs, group 2) Qβ(CpGs)-p33 vaccine using SMPH cross-linker, and group 3) Qβ(CpGs)-p33 vaccine using DBCO cross-linker. (E) Percentage of CD8+ IFN-γ+ secreting cells (means ± SEM) in the spleen of vaccinated groups. (F) CFSE in vivo lytic activity in the spleen of vaccinated groups, using the formula 100X(1–CFSEHi pulsed/CSFELow un-pulsed). Statistical analysis by Students t-test. (G) Representative FACS plots showing the percentage of CD8+ Tetramer+ cells in the spleen of vaccinated groups. (H) Representative FACS histogram of CFSE in vivo lytic activity in the spleen of vaccinated groups. (n = 3) mice per group, one representative of 3 similar experiments is shown. *P < 0.05; **P < 0.01; ***P < 0.001; ****P < 0.0001.

