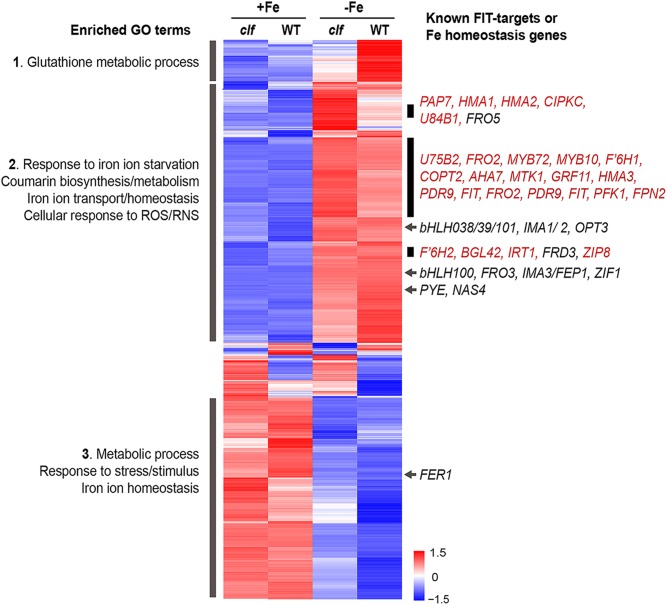
FIGURE 3.
Cluster analysis of genes differentially regulated by iron in wild type and clf roots. Heat map of genes differentially regulated by iron in wild type or clf root tissue. Enriched GO terms and known iron homeostasis genes or FIT-regulated genes (red) in the subsets highlighted are indicated. Numbers on the scale bar represent standard deviation from the mean.

