
Figure 5.
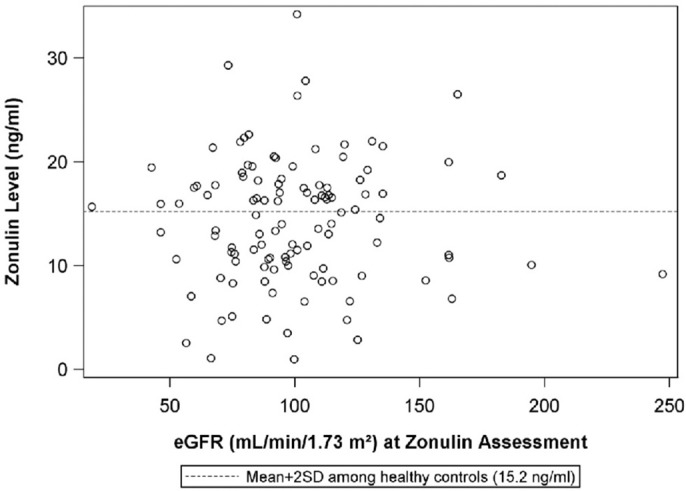
The scatterplot illustrates the relationship between plasma zonulin level and the urine protein:creatinine ratio at the time of the zonulin measurement. The dashed line indicates-the mean+2SD plasma zonulin level in healthy adult control participants. Rho = 0.083 p = 0.76, R2 < 0.01. eGFR, estimated glomerular filtration rate; SD, Standard deviation.