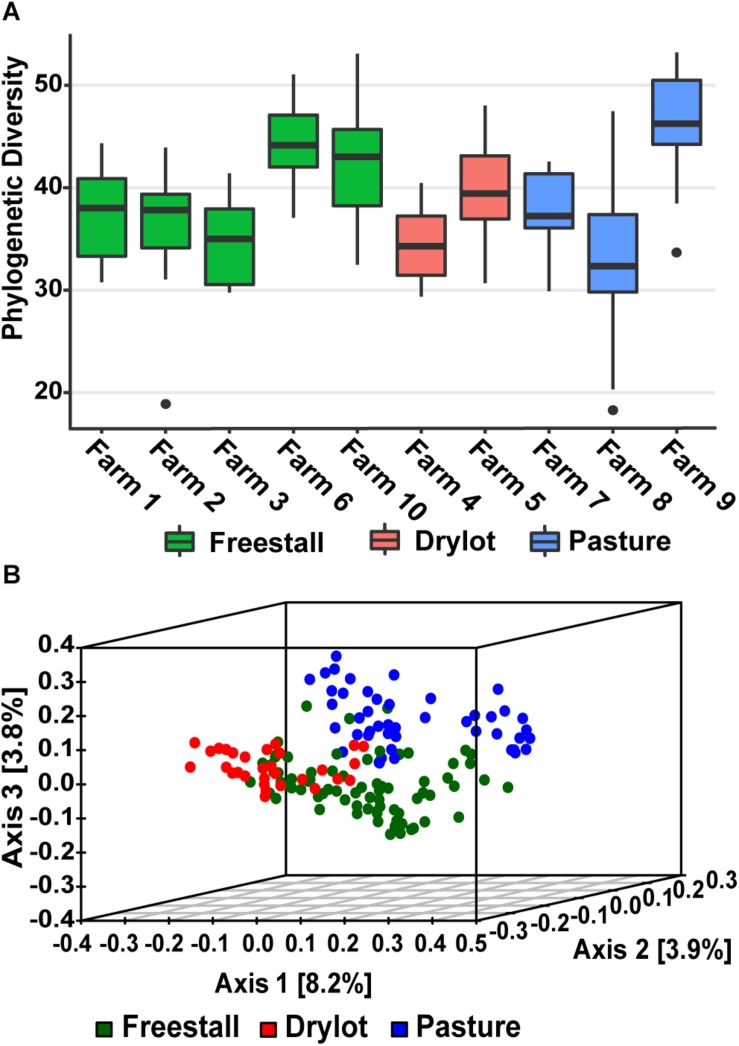
FIGURE 1.
Alpha and beta diversity of samples. (A) Average Phylogenetic Diversity (PD) across farms was determined by averaging the sum of all branch lengths of the OTUs present in each fecal sample (Faith’s PD). Alpha diversity of fecal bacterial communities was not significantly affected by housing type, but farm did significantly (p = 4.9 × 10⁻¹⁰) affect alpha diversity. (B) Beta diversity of samples graphed as PCoA of unweighted UniFrac distances colored by housing type. Pasture farms cluster way from the other housing types and are more similar to freestall then dry lot farms.

