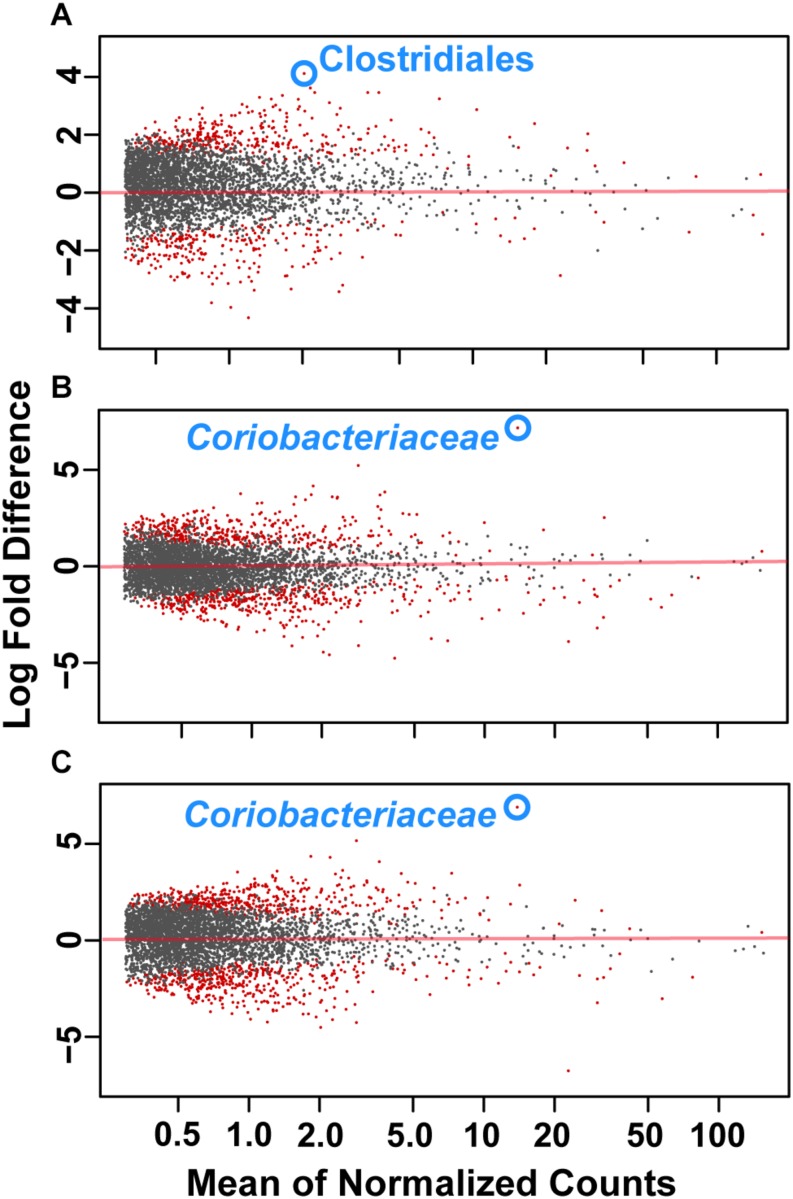
FIGURE 4.
Log2 fold-difference in OTU abundance from samples comparing (A) freestall to drylot (B) pasture to freestall and (C) pasture to drylot housing. Significantly changed OTU abundance are shown in red determined by an adjusted p ≤ 0.01. The most significantly changed OTU is circled and labeled with assigned taxonomy. The family Coriobacteriaceae showed the most significant change on pasture farms compared to both non-pasture systems while the order Clostridiales was most significantly changed in freestall farms compared to drylots.

