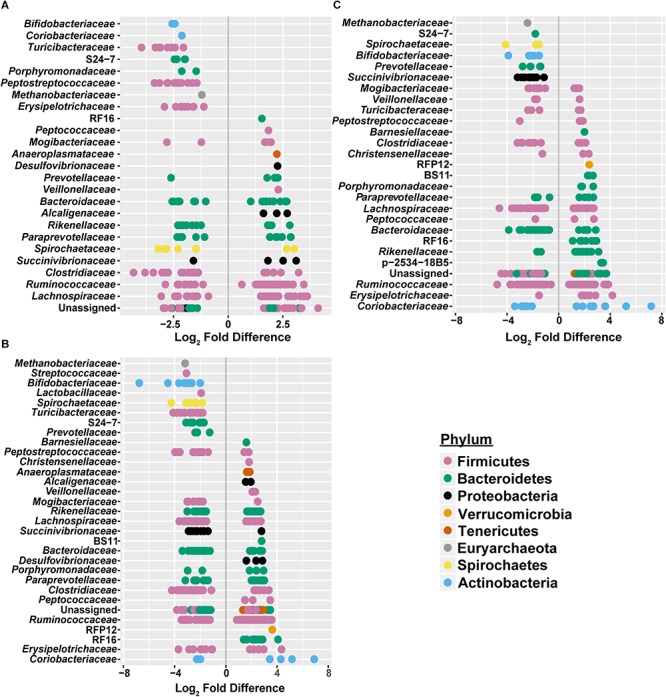
FIGURE 5.

Significant log2 fold-differences of bacterial families’ abundance between (A) freestall and drylots (B) pasture and freestalls and (C) pasture and drylots are presented. Each point is colored by its assigned phyla and represents an OTU that showed a significant difference in abundance between the two housing types compared. Negative values denote a log2 fold reduction of that OTU in the first housing type compared to the second. Similarly, positive values denote log2 fold increases of an OTU in the first housing type compared to the second. Comparisons of between housing types shared log2 fold differences in many of the same families. Adjusted p ≤ 0.01 considered significant.
