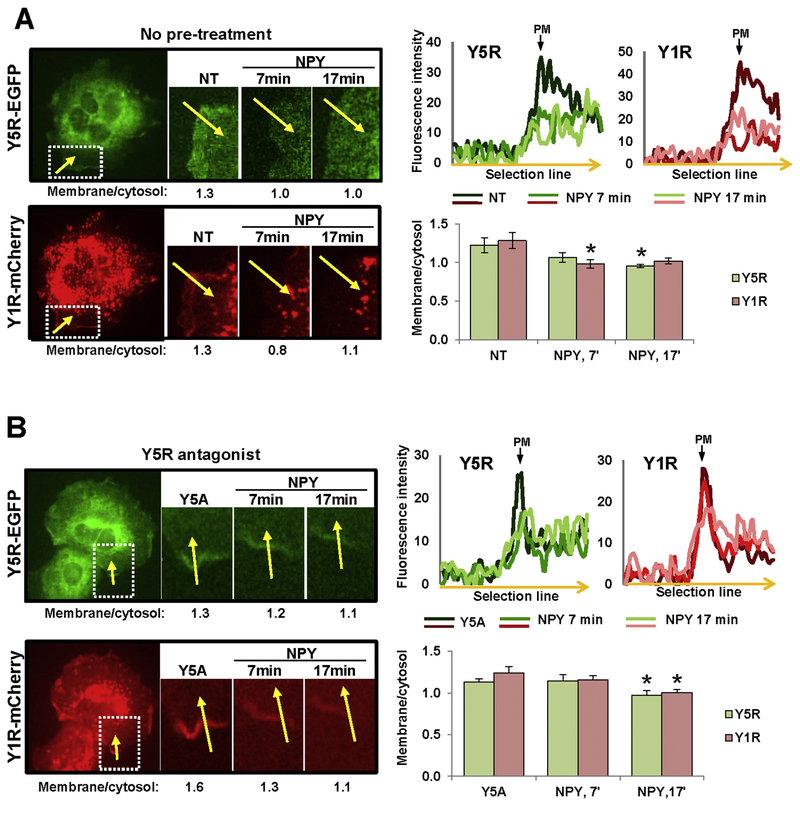
Figure 5. Y5R antagonist does not block NPY-induced internalization of Y5R in CHOK1/Y1R-mCherry/Y5R-EGFP cells.
A. Representative time-lapse fluorescence microscopy images of CHO-K1 cell transfected with Y5R-EGFP and Y1R-mCherry. The region with membrane localization of both receptors was selected for analysis (white box). The numbers below microscopic images indicate fluorescence ratios of the selected membrane section to its corresponding sub-cellular cytosol area (membrane/cytosol) for this representative region at the desired time points upon stimulation with 10−7M NPY. The linear graphs show green and red fluorescence intensities across the membrane in the selected region (along the yellow arrow) at the desired time points upon NPY stimulation. The bar graph depicts quantitative analysis of the membrane/cytosol fluorescence ratios at the selected time points upon NPY stimulation for all cells analyzed (9 independent regions). B. Analysis of the NPY-induced receptor internalization performed in CHO-K1/Y1R-mCherry/Y5R-EGFP cells pre-treated for 15 min with Y5R antagonist, CGP71683, at a concentration of 10−6M. The cell treatment, measurements and analyses were performed for 7 independent regions, as described above (A). NT – non-treated cells; Y5A – cells upon Y5R antagonist pre-treatment; PM – plasma membrane. * p<0.05 vs. NT by paired t-test.

