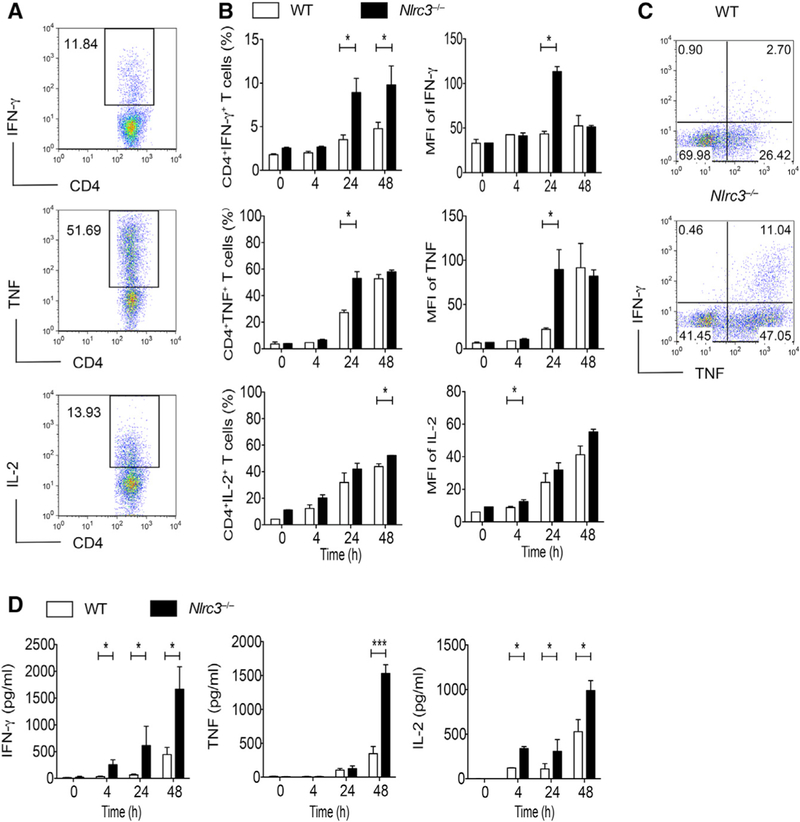
Figure 2. NLRC3 Negatively Regulates Cytokine Expression by Activated CD4+ T Cells.
CD4+ T cells purified from WT and Nlrc3−/− mice were stimulated with anti-CD3 (5 μg/mL) and anti-CD28 (2 μg/mL) antibodies and incubated for 0, 4, 24, and 48 hr.
(A) Flow-cytometry analysis of CD4+IFN-γ+, CD4+TNF+, and CD4+IL-2+ cells.
(B) Percentages of IFN-γ+, TNF+, and IL-2+CD4+ T cells; MFI of IFN-γ expression among IFN-γ+CD4+ cells; MFI of TNF expression among TNF+CD4+ cells; and MFI of IL-2 expression among IL-2+CD4+ cells by intracellular staining.
(C) Representative results at the 24 hr time point of (B).
(D) IFN-γ, TNF, and IL-2 in supernatants of CD4+ T cell cultures as measured by ELISA.
Representative data from three experiments are presented as mean ± SEM. Statistical significance was determined by unpaired t test. *p < 0.05, **p < 0.01, ***p < 0.001. See also Figure S3.

