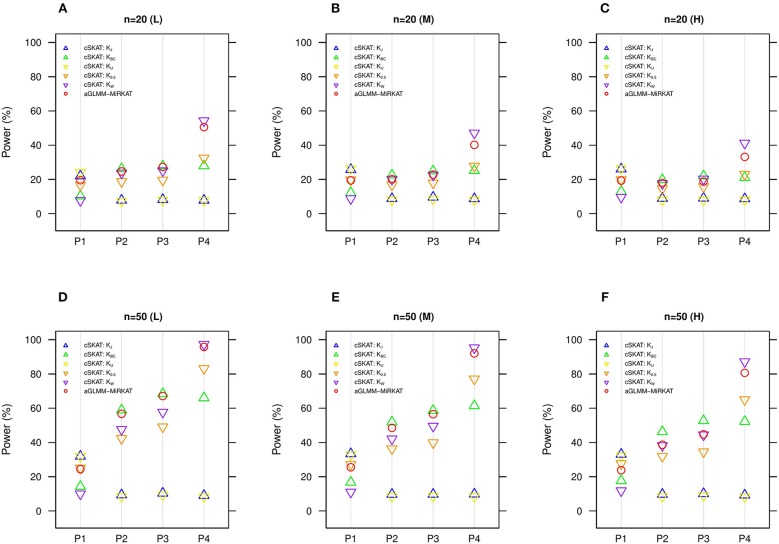
Figure 3.
Estimated statistical powers for the item-by-item cSKAT tests and aGLMM-MiRKAT based on the random intercept model with Gaussian responses (n = 50) (Unit: %). L: low within-cluster correlation ( = ); M: medium within-cluster correlation ( = ); H: high within-cluster correlation ( ).KJ:cSKAT for Jaccard dissimilarity; KBC:cSKAT for Bray-Curtis dissimilarity; KU:cSKAT for Unweighted UniFrac distance; K0.5: cSKAT for Generalized UniFrac distance (θ = 0.5); KW: cSKAT for Weighted UniFrac distance; adaptive: adaptive GLMM-MiRKAT (aGLMM-MiRKAT). P1, P2, P3, and P4 represent the four different association scenarios: P1. = {50 random OTUs in lower half of abundance}; P2. = {50 random OTUs}; P3. = {50 random OTUs in upper half of abundance}; P4. = {A random cluster among 10 clusters partitioned by PAM}. (A) n = 20 (L); (B) n = 20 (M); (C) n = 20 (H); (D) n = 50 (L); (E) n = 50 (M); (F) n = 50 (H).

