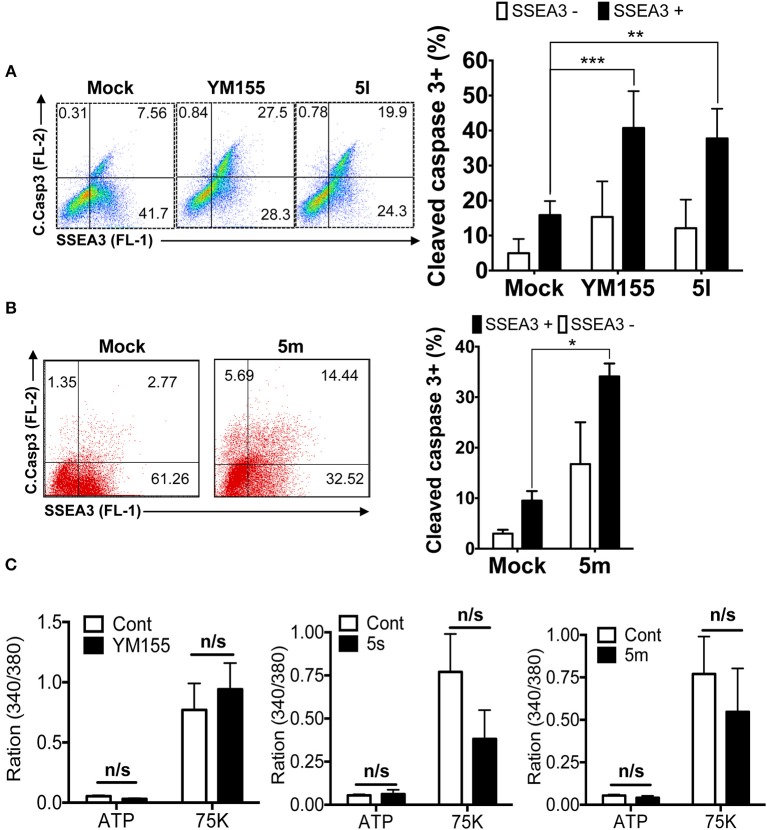
Figure 4.
Stemotoxic activity of 5m (A) FACS analysis for cleaved caspase3 and SSEA3 staining after treatment of YM155 or 5l (left), Percentages of cleaved caspase3+ cells were presented by bar graph (right) (n = 4) (P < 0.01 (**), 0.001 (****)). (B) FACS analysis for cleaved caspase3 and SSEA3 staining after treatment of 5m, Percentages of cleaved caspase3+ cells were presented by bar graph (right) (n = 4) (P < 0.05 (*)). (C) Net changes in intracellular calcium levels in response to a pharmacological agonist, ATP (20 μM) or membrane depolarization (75 mM K+) after treatment of indicated chemicals in the SMC3 cells.

