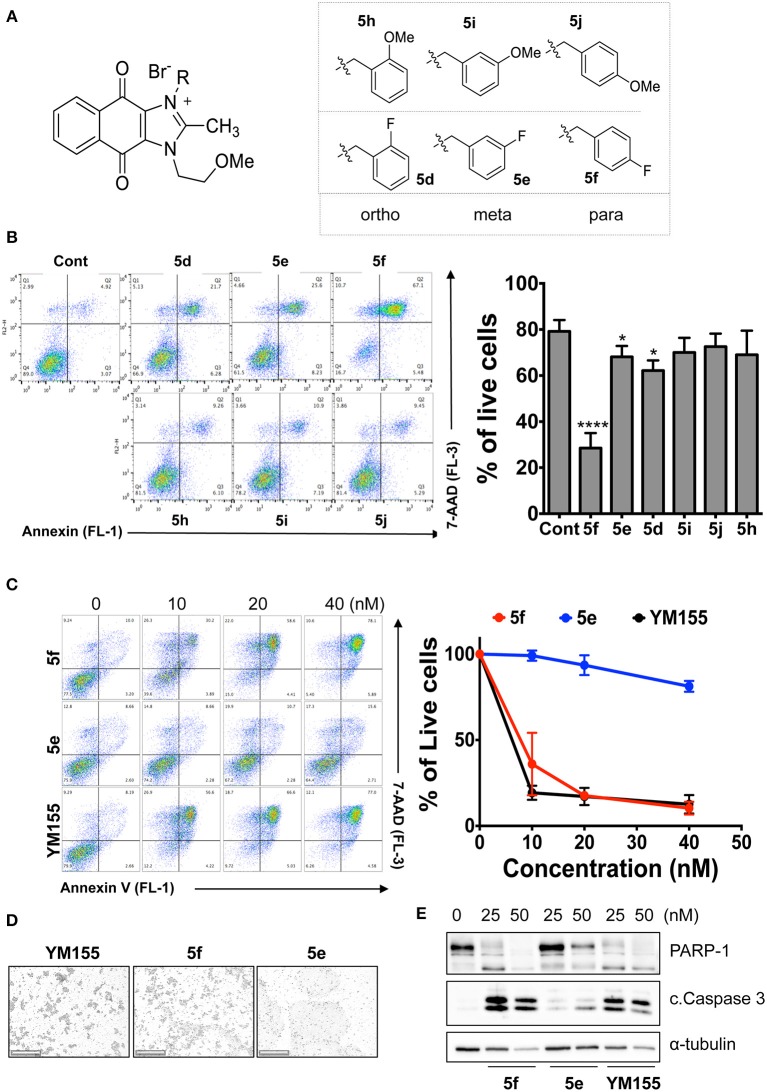
Figure 5.
Hydrogen bond acceptors strongly influence the stemotoxic activity of YM155 analogs (A) Chemical backbone structure of YM155 analogs (left) and six YM155 analogs (right). (B) FACS analysis for Annexin-V/PI staining after treatment of indicated compounds, Percentages of live cells (Annexin-V negative and PI negative Cells) were presented as bar graph (right) (n = 6) (P < 0.05 (*), 0.0001 (****)). (C) FACS analysis for Annexin-V/7-AAD staining after indicative concentration of YM155 and YM155 analogs (5e or 5f) (left). Percentages of live cells (Annexin-V negative and 7-AAD negative Cells) were presented as bar graph (right). (D) Light microscopic images after treatment of 20 nM of YM155 and YM155 analogs (Scale bar = 500 μm). (E) Immunoblotting analysis for PARP-1 and cleaved caspase 3 (C.Casp3) after indicative concentration of YM155 analogs, α-tubulin for equal protein loading control.

