Figure 2.
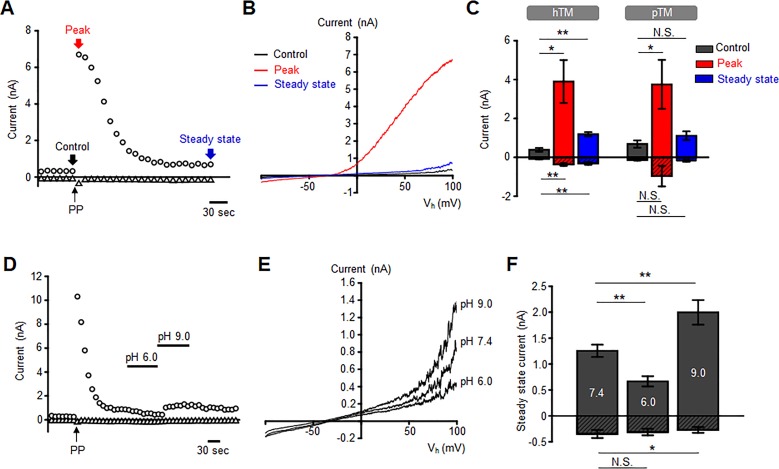
External pH modulates mechanogated current in hTM cells. (A) A representative time course of pressure-induced current in hTM cells induced by a pressure pulse (PPs) (arrow) in the presence of 100 μM DIDS; the holding potentials were −100 (triangles) and +100 mV (circles). (B) Current–voltage relationship of control, peak, and steady-state current recorded in time-points shown in A. (C) Summary of peak and steady-state components of the pressure-induced current (−100 mV, patterned bars and +100 mV, open bars) for hTM (n = 8 cells) and pTM cells (n = 8 cells, N = 2 donors). Shown are the mean ± SEM. Not Significant (N.S.)P > 0.05; *P < 0.05. (D) The steady-state component of pressure-induced current is sensitive to pHo. (E) The current–voltage relationships from the experiment is shown in D. (F) Summary of the experiments in D and E. Patterned and open bars represent the currents recorded at −100 and +100 mV, respectively, and plotted as means ± SEM. Pair-sample t-test. n = 8 cells. N.S.P > 0.05; *P < 0.05; **P < 0.01.

