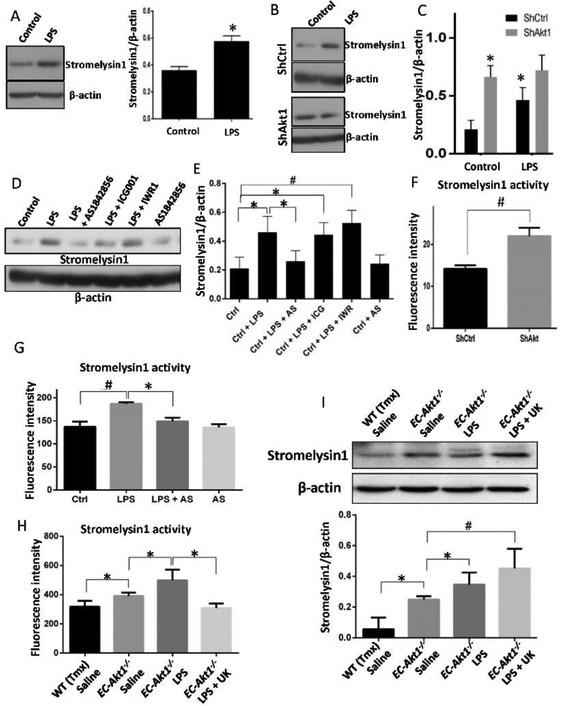
FIGURE 4: Treatment of primary HPAECs with LPS induces increased expression and activity of stromelysin1 via Akt1-FoxO1/3a signaling.
(A) Western blot images and densitometry analysis of HPAEC lysates after treatment with 100ng/ml LPS showing enhanced stromelysin1expression after 24 hrs (n=4). (B-C) Western blot images and densitometry analysis of ShControl and ShAkt1 HMEC lysates showing enhanced stromelysin1 expression upon treatment with LPS in ShControl, but not in ShAkt1 cells and that expression levels of Stromelysin1 is already high in ShAkt1 HMECs compared to ShControl cells (n=5). (D-E) Western blot images and densitometry analysis of HMEC lysates showing increased expression of stromelysin1 with LPS treatment and a significant reversal of stromelysin1 expression upon co-treatment with FoxO1/3a inhibitor (10 μM AS1842856), but not with β-Catenin inhibitors (10 μM each of ICG001 and IWR-1) (n=4). (F) Bar graph showing increased activity of stromelysin1 in ShAkt1 HMEC lysates compared to ShControl (n=5). (G) Bar graph showing Stromelysin1 activities in LPS treated HMEC lysates compared to PBS treated controls and its reversal upon co-treatment with FoxO1/3a inhibitor AS1842856 (n=3). (H) Bar graph showing Stromelysin1 activities in LPS treated WT and EC-Akt1−/− mouse lung lysates compared to saline-treated controls and its reversal upon co-treatment with stromelysin1 inhibitor UK-356618 (n=5-6). (I) Western blot images and densitometry analysis of WT and EC-Akt1−/− mouse lung lysates probed for stromelysin1. The bar graph shows a significant increase in stromelysin1 expression in EC-Akt1−/− mouse lung lysates compared to WT, which is further elevated upon LPS injury (n=6). * (p<0.05); # (p<0.01), unpaired Student’s t-test for two groups and One-way ANOVA-Ordinary for more than two groups (GraphPad Prism 6.01).

