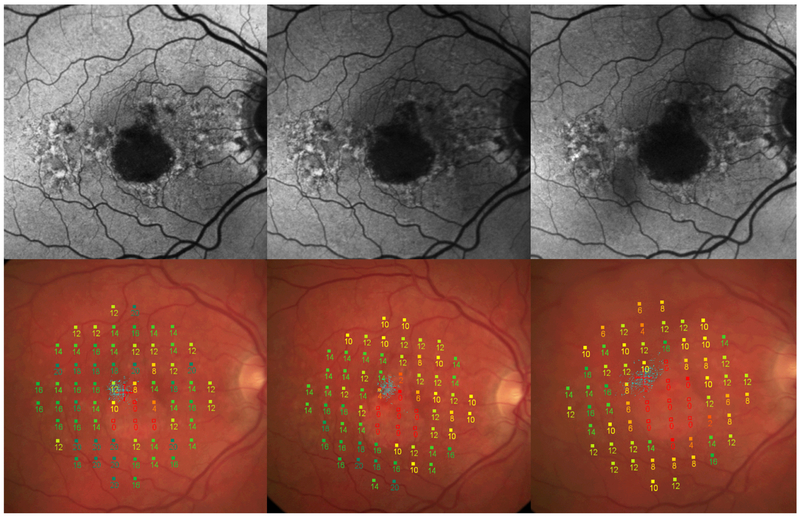
Fig. 3. Microperimetry assessments of geographic atrophy progression over 1 year.
Fundus autofluorescence images (top) and color fundus photography images (bottom, with microperimetry grid overlaid) from the same patient showing geographic atrophy progression at baseline (left), 6 months (middle), and 12 months (right).

