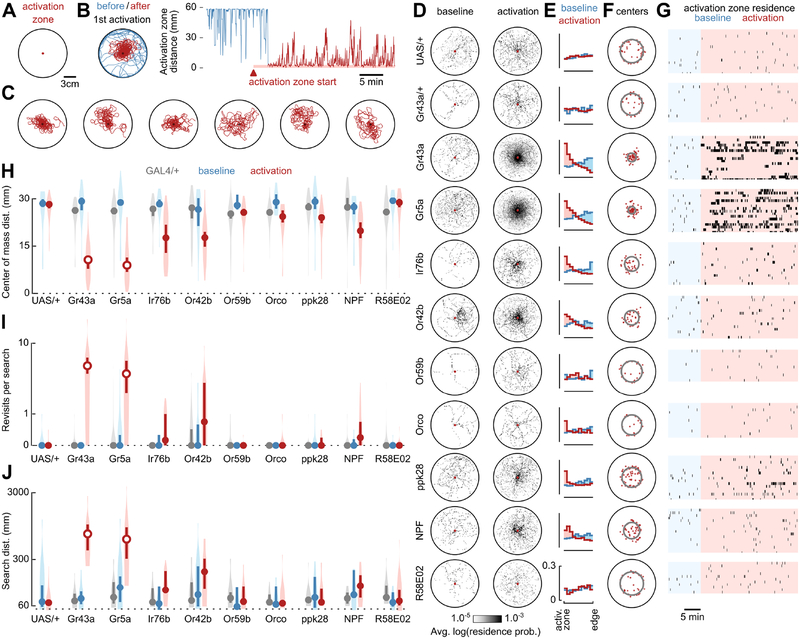
Figure 1. Optogenetic activation of sugar-receptors triggers local search.
(A) Schematic of experimental arena featuring an optogenetic activation zone. A female Drosophila is about 3 mm in length.
(B) Left: example trajectory of Gr43a-GAL4>UAS-CsChrimson fly before (blue) and after (red) first optogenetic stimulation. Right: the same data, plotted as the distance between the fly and activation zone center. The activation zone becomes operational after an initial 10-minute baseline control period.
(C) Six of the seven longest distance search bouts (left to right) triggered by Gr43a-GAL4 activation; the longest bout is plotted in (B). Data include search bouts truncated by the conclusion of the trial.
(D) Residence probabilities of walking trajectories during activation search bouts (with light pulses) and baseline control bouts (without light pulses). Each 2-D spatial probability histogram shows the mean of the mean normalized residence probability distribution of each fly. Throughout the paper (unless otherwise noted), analyses in free-walking flies excluded search bouts truncated by the conclusion of the trial, as well as any timepoints when the fly was stopped or in the activation zone. UAS/+ indicates data for UAS-CsChrimson;+ parental controls. Gr43a/+ (for example) indicates data for Gr43a-GAL4;+ parental controls whereas Gr43a indicates corresponding data for Gr43a-GAL4>UAS-CsChrimson experimental flies.
(E) Probability distributions of distance between fly and activation zone during activation search bouts (red) or baseline control bouts (blue). Each probability histogram shows the mean of the mean normalized probability distribution of each fly.
(F) Centers of mass for all activation search bouts (red dots). Grey rings show the distance from the activation zone of the median center of mass.
(G) Raster plots of activation zone residence during baseline (blue) and while the activation zone is operational (red). Marks are graphically extended horizontally by 5 seconds for visibility.
(H) Distance from the arena center for centers of mass of baseline control bouts (blue), activation search bouts (red) and activation search bouts of GAL4-line parental controls (grey). Circles depict medians, error bars depict 95% confidence intervals, and violin plots indicate full data distribution. Unfilled circles indicate cases in which the median is statistically different (p≤0.05, with Bonferroni correction) from both baseline condition (Wilcoxon signed-rank test) and GAL4-line parental control (where applicable, Mann-Whitney U test).
(I) Mean number of revisits to the activation zone (plotted on a log axis) during baseline control bouts (blue), activation search bouts (red), and activation search bouts of GAL4-line parental controls (grey). Plotting conventions as in (H).
(J) Mean distance walked (plotted on a log axis) during baseline control bouts (blue), activation search bouts (red), and activation search bouts of GAL4-line parental controls (grey). Plotting conventions as in (H).
(C-J) Sample sizes (throughout paper, expressed as number of flies): Gr43a, n=20; Gr43a/+, n=15; UAS/+, n=23; Gr5a, n=20; Gr5a/+, n=16; Ir76b, n=16; Ir76b/+, n=12; Or42b, n=16; Or42b/+, n=13; Or59b, n=12; Or59b/+, n=18; Orco, n=13; Orco/+, n=18; ppk28, n=18; ppk28/+, n=14; NPF, n=18; NPF/+, n=11.
See also Figures S1 and S2.

